Investigating the alterations of historical climate data, this article scrutinizes the methodology and repercussions of NOAA and NASA's data adjustments.
The examination of historical climate data and the methodologies used to interpret this data is crucial in understanding long-term climate trends. This article analytically reviews the data presentation methods of organizations such as NOAA (National Oceanic and Atmospheric Administration) and NASA, with a specific focus on temperature records from the late 19th century to the present, and the implications of data adjustments on climate research.
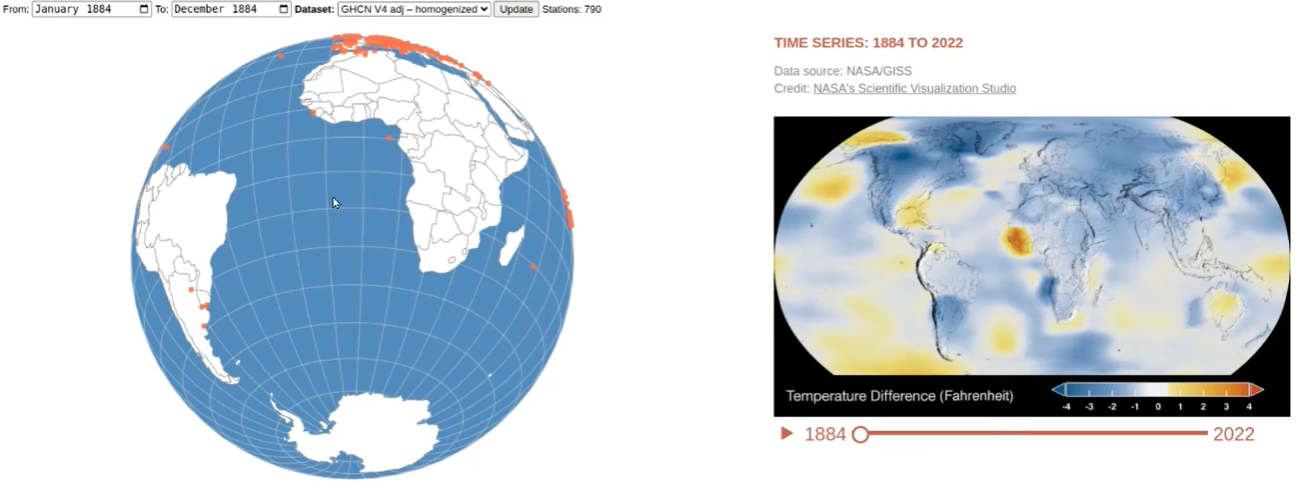
In the late 19th century, global temperature data was sparse. Regions such as South America, Africa, the Middle East, and Antarctica had limited to no temperature measurements available. Despite the scarcity of the data, temperature maps for these years have been created that may not accurately reflect historical conditions due to the lack of empirical measurements in these regions.
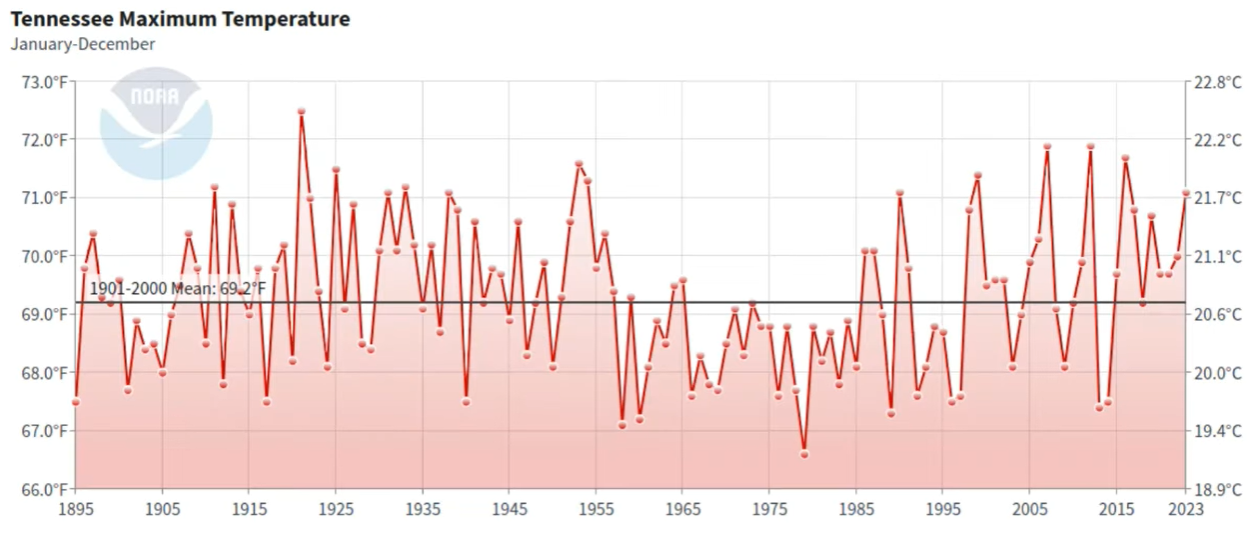
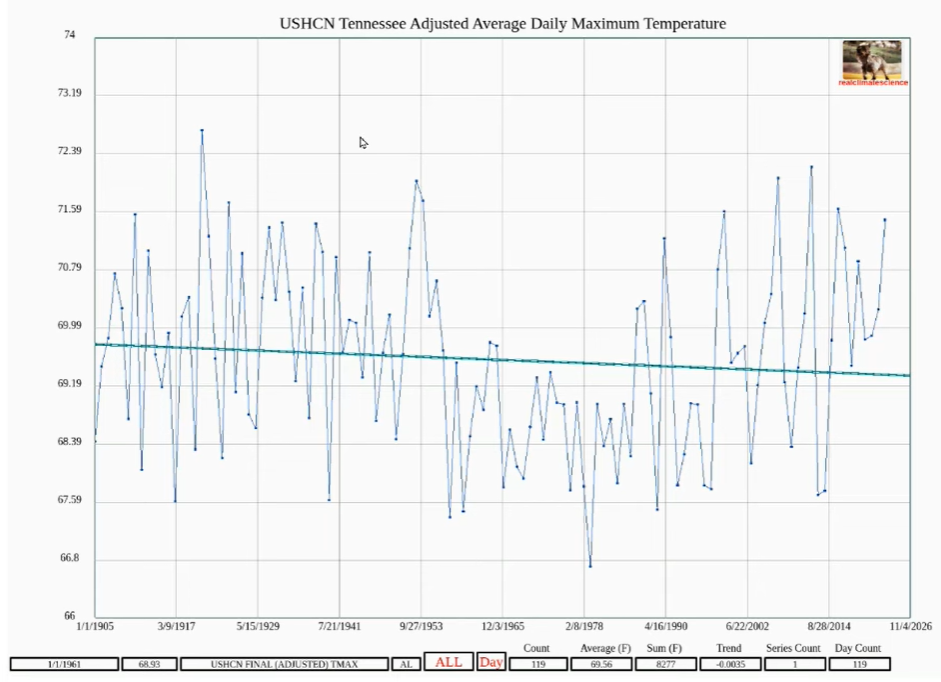
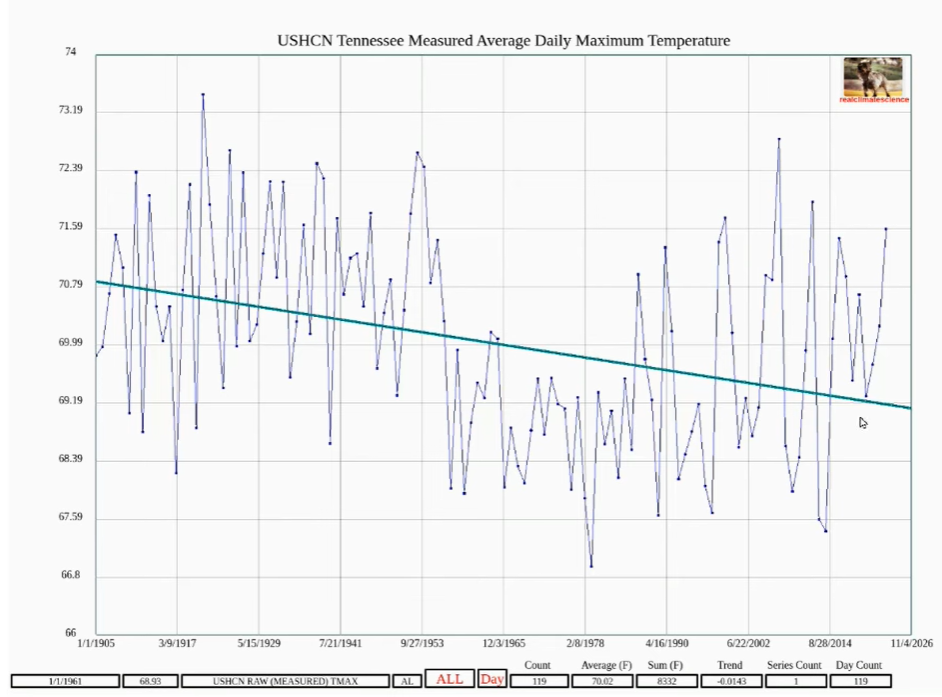
NOAA has been known to adjust historical temperature data, which can significantly alter the perceived climate trends. For instance, in Tennessee, the original thermometer readings suggest that the warmest year was 1921, followed by a strong cooling trend. However, NOAA's adjustments appear to diminish this cooling trend. A discrepancy arises when comparing the adjusted data set to the raw thermometer data, leading to concerns about the validity of the adjusted data for scientific research.
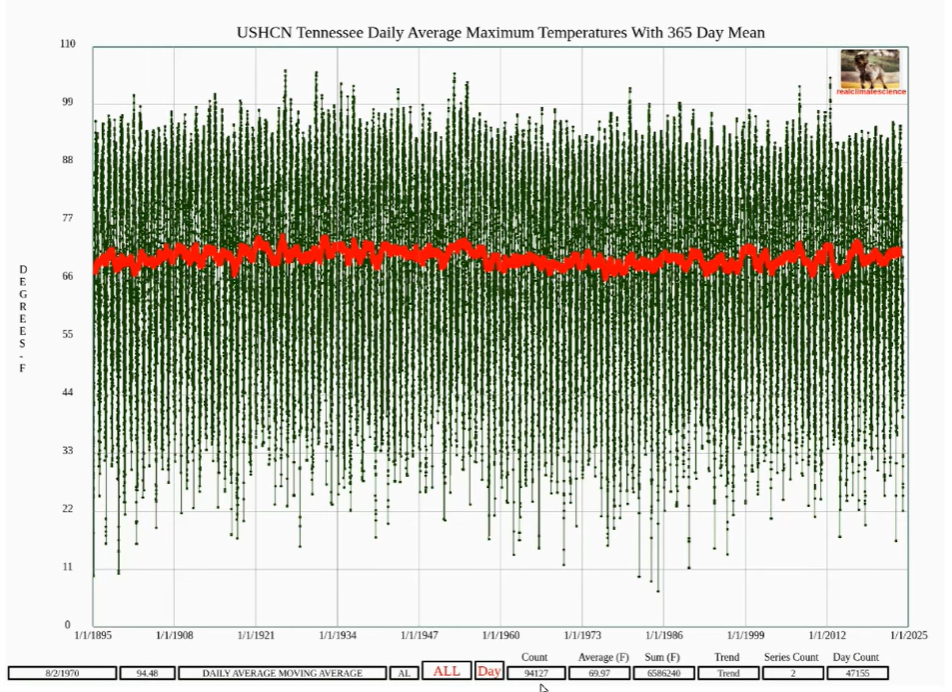
A detailed analysis of the temperature data in Tennessee from 1895 shows approximately 94,000 daily maximum temperature records. The raw data exhibits large annual swings due to seasonal variations, which can be filtered out to observe long-term trends. By calculating a 365-day mean, a low pass filter is applied to the data, enabling the identification of cyclical patterns.
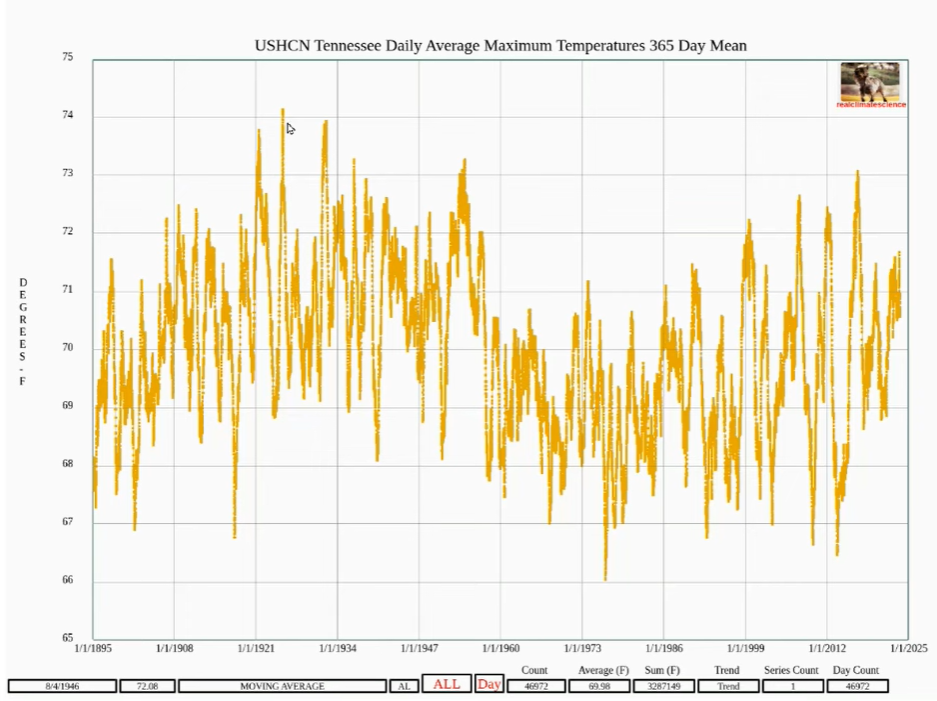
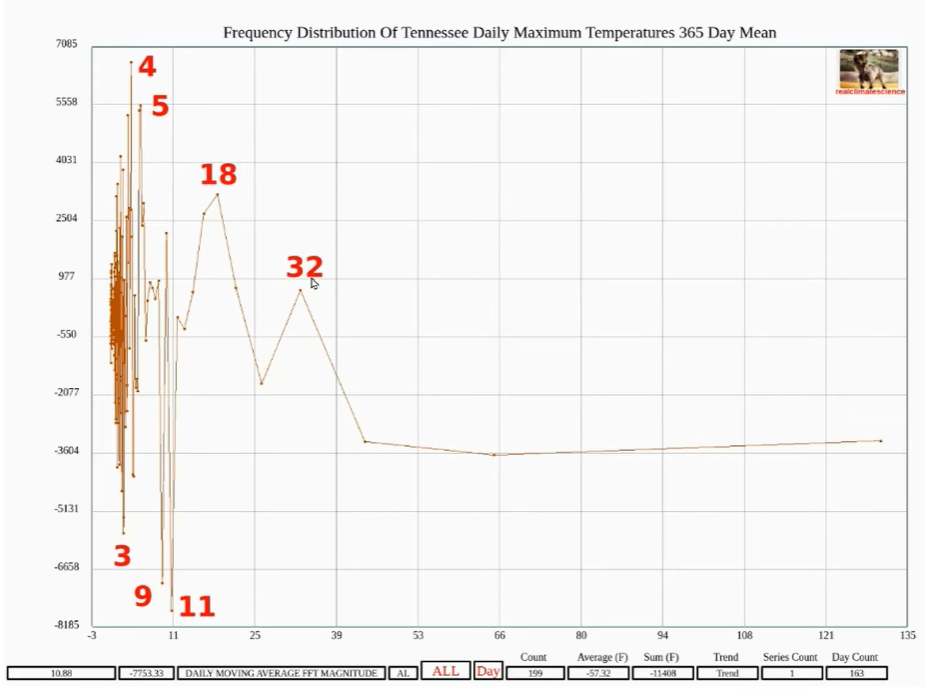
The filtered data reveals long-term cyclical patterns aligning with the Atlantic Multidecadal Oscillation, as well as short-term oscillations with periods of three, four, five, nine, eleven, eighteen, thirty-two years, among others. Notably, the eleven-year cycle corresponds with the sunspot cycle, suggesting a possible link between solar activity and the climate in Tennessee.
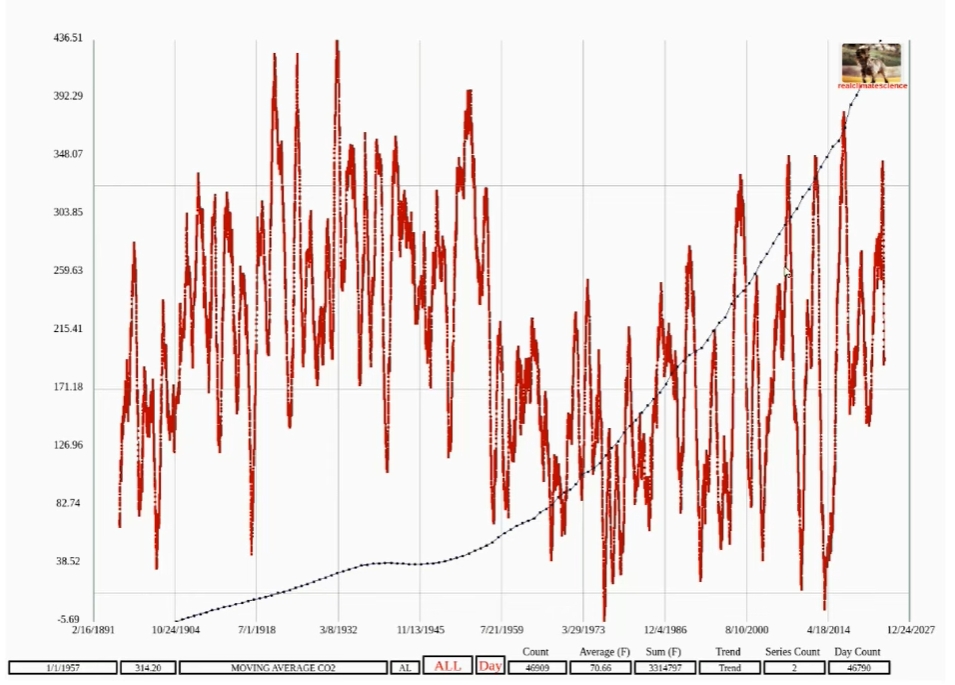
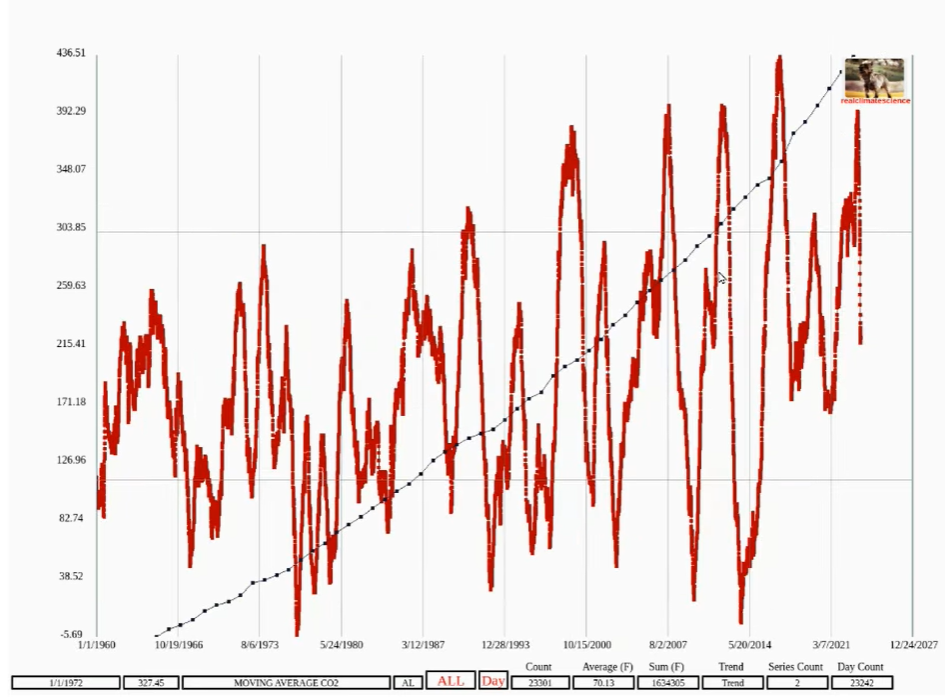
An important aspect of the climate debate is the correlation between carbon dioxide levels and temperature trends. In the case of Tennessee, there appears to be no direct correlation between temperatures and carbon dioxide when examining the unadjusted data. However, the adjusted data could potentially create a false appearance of a correlation by cooling past temperatures, particularly those before 1960, to fit a narrative that rising carbon dioxide levels lead to increased temperatures.
The practice of adjusting historical temperature data raises questions about the integrity of climate research. Adjustments that cool past temperatures have been used to misrepresent historical climate trends and lead to incorrect conclusions about the relationships between carbon dioxide levels and temperature changes. It is essential that climate data is presented transparently and accurately to combat the climate hysteria.