Bucyrus' Climate Reality vs. Media Projections
This article delves into the contrasting narratives of climate change as presented by historical data versus media projections in Bucyrus, Ohio.

This article examines the climate data for Bucyrus, Ohio, specifically focusing on the number of days per year with temperatures exceeding 90 degrees Fahrenheit (32 degrees Celsius), and compares historical data with contemporary media representations and projections.
Historical Climate Data for Bucyrus, Ohio
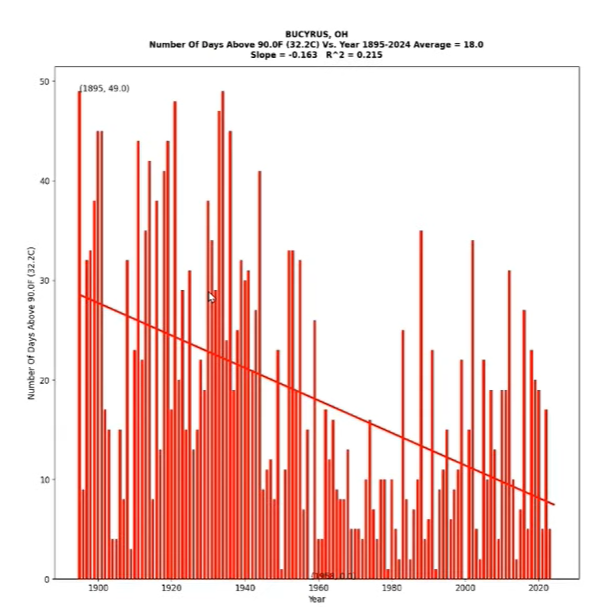
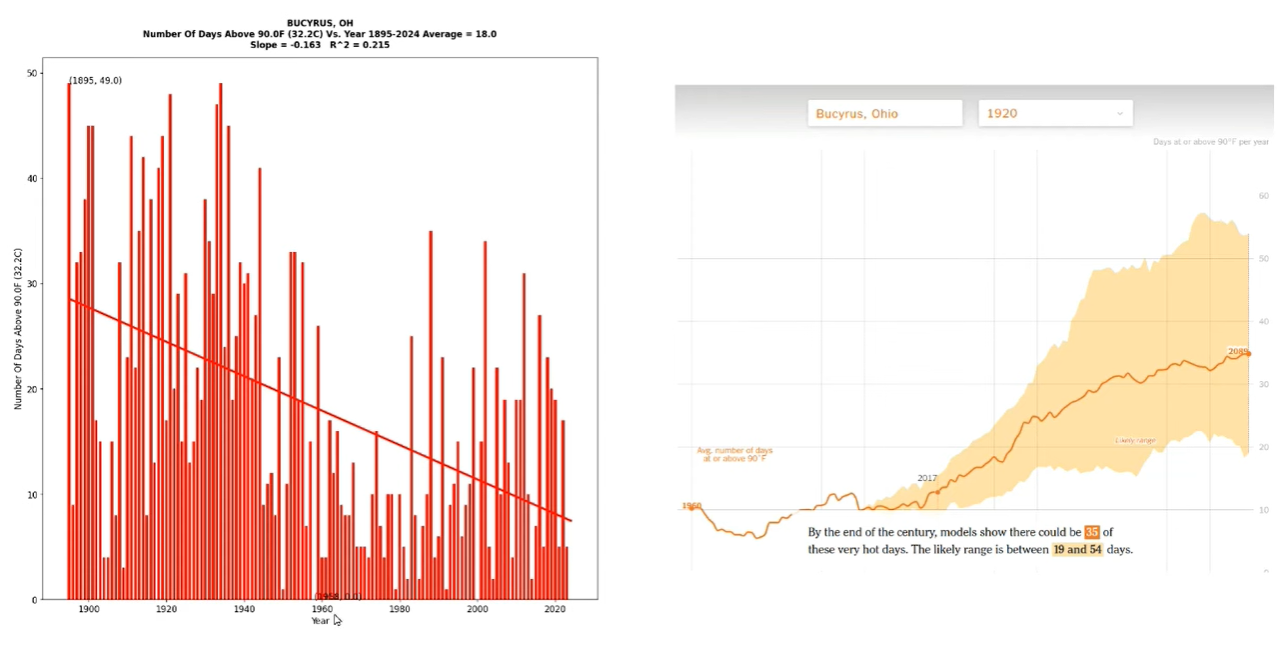
Historical temperature records for Bucyrus, Ohio indicate a marked change in the climate over the past century. Data available from 1895 shows that prior to 1960, Bucyrus experienced an average of approximately 25 days per year with temperatures over 90 degrees. However, the trend shifted post-1960, with the average number of such hot days dropping to around 11 per year.
Media Representation of Climate Data
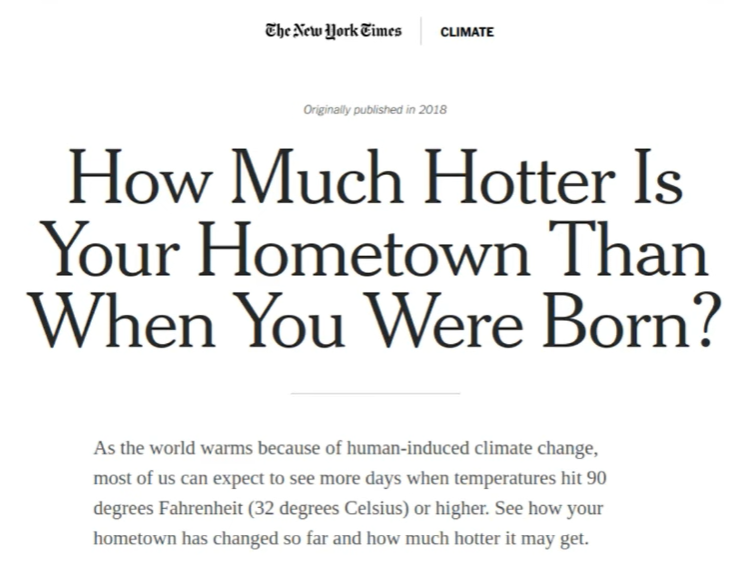
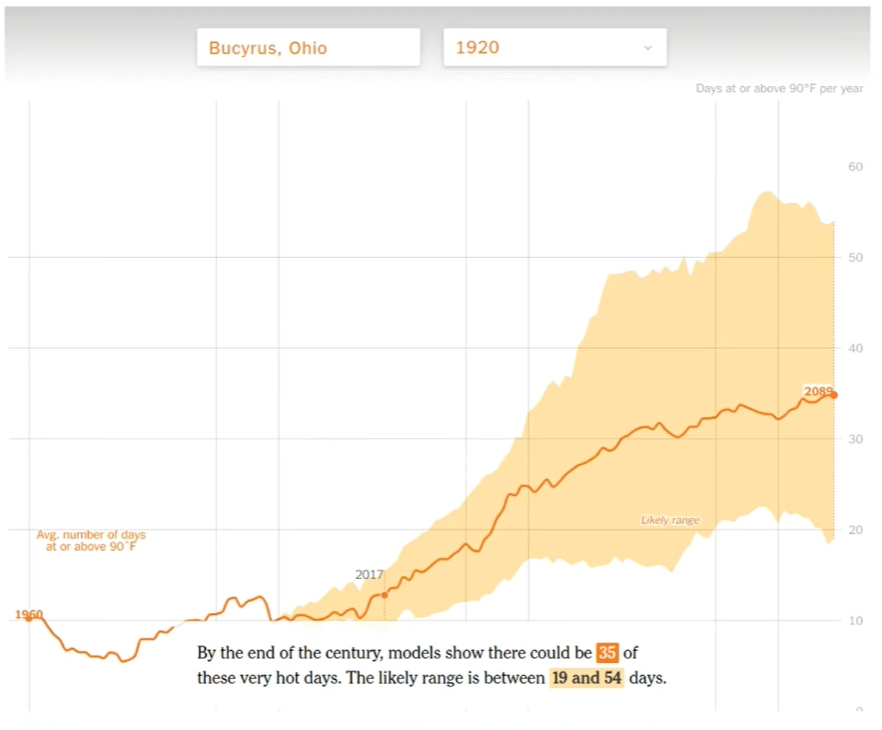
A recent analysis of climate trends by the New York Times suggested that, as a consequence of human-induced climate change, regions like Bucyrus should expect an increase in the number of days reaching 90 degrees or higher. The New York Times' data interface allowed users to explore temperature changes starting from 1920, though their data set reportedly begins in 1960. According to their analysis, the Bucyrus area could anticipate about ten such hot days per year based on records starting from that year.
Discrepancies and Projections
The New York Times' projections indicate a potential rise in the number of 90-degree days by the end of the century, with models showing a possibility of 35 such days, and a likely range between 19 and 54 days. This projection is in stark contrast to the actual data available for Bucyrus prior to 1960, which showed a higher occurrence of hot days than what is currently being experienced.
Comparative Analysis of Data and Models
When comparing the modeled predictions provided by the New York Times with the actual historical data from Bucyrus, discrepancies emerge. The historical data shows a decline in the frequency of hot days, whereas the models predict an increase. The exclusion of data prior to 1960 in the New York Times' analysis raises questions about the completeness of their representation and the validity of their projections.
Nationwide Trends
The trend observed in Bucyrus is reportedly not isolated. Data averaged across the United States suggests a similar downward trend in the number of 90-degree days. This nationwide trend contrasts with the narrative suggesting an overall warming that would increase the frequency of such hot days.
Conclusion
The examination of climate data for Bucyrus, Ohio, reveals a significant reduction in the number of days exceeding 90 degrees Fahrenheit since the mid-20th century. This historical trend contradicts projections that suggest an increase in such hot days as a result of climate change. Disparities between actual historical data and the data sets used by media outlets like the New York Times highlight the importance of comprehensive data analysis in climate science. As with any scientific endeavor, ensuring the integrity and completeness of data is fundamental to producing accurate and reliable models and predictions.