Analysis of Midwest Temperature Trends and National Climate Predictions
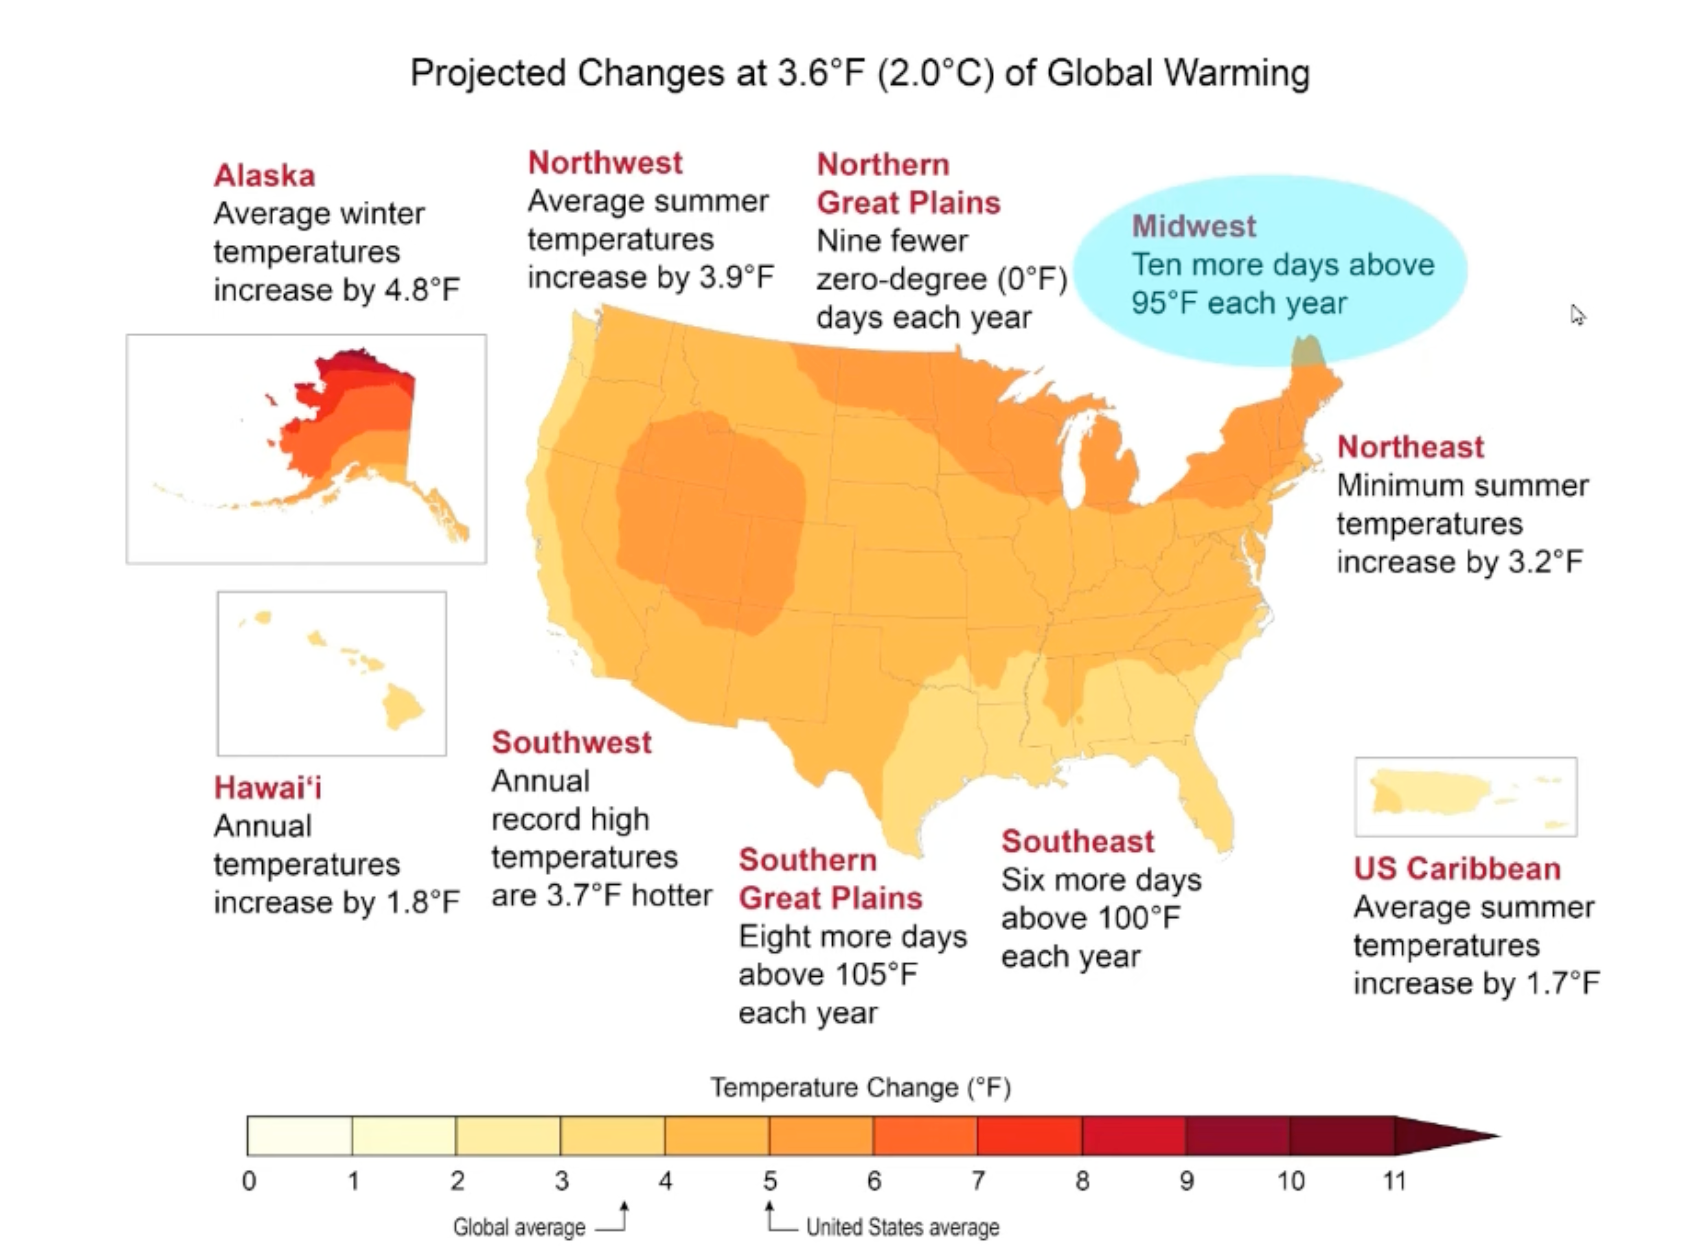
The National Climate Assessment provides forecasts and analyses on climate trends and their impacts across the United States. One of its predictions highlights an expected increase in the number of very hot days in the U.S. Midwest.


The National Climate Assessment provides forecasts and analyses on climate trends and their impacts across the United States. One of its predictions highlights an expected increase in the number of very hot days in the U.S. Midwest. This article examines historical temperature data to evaluate the accuracy of these predictions.
Midwest Temperature Trends
According to the National Oceanic and Atmospheric Administration (NOAA), the Midwest region includes Minnesota, Wisconsin, Iowa, Illinois, Missouri, Indiana, Ohio, and Michigan. Historical data on temperature trends within these states indicate patterns in the frequency of days above 95 degrees Fahrenheit (35 degrees Celsius).
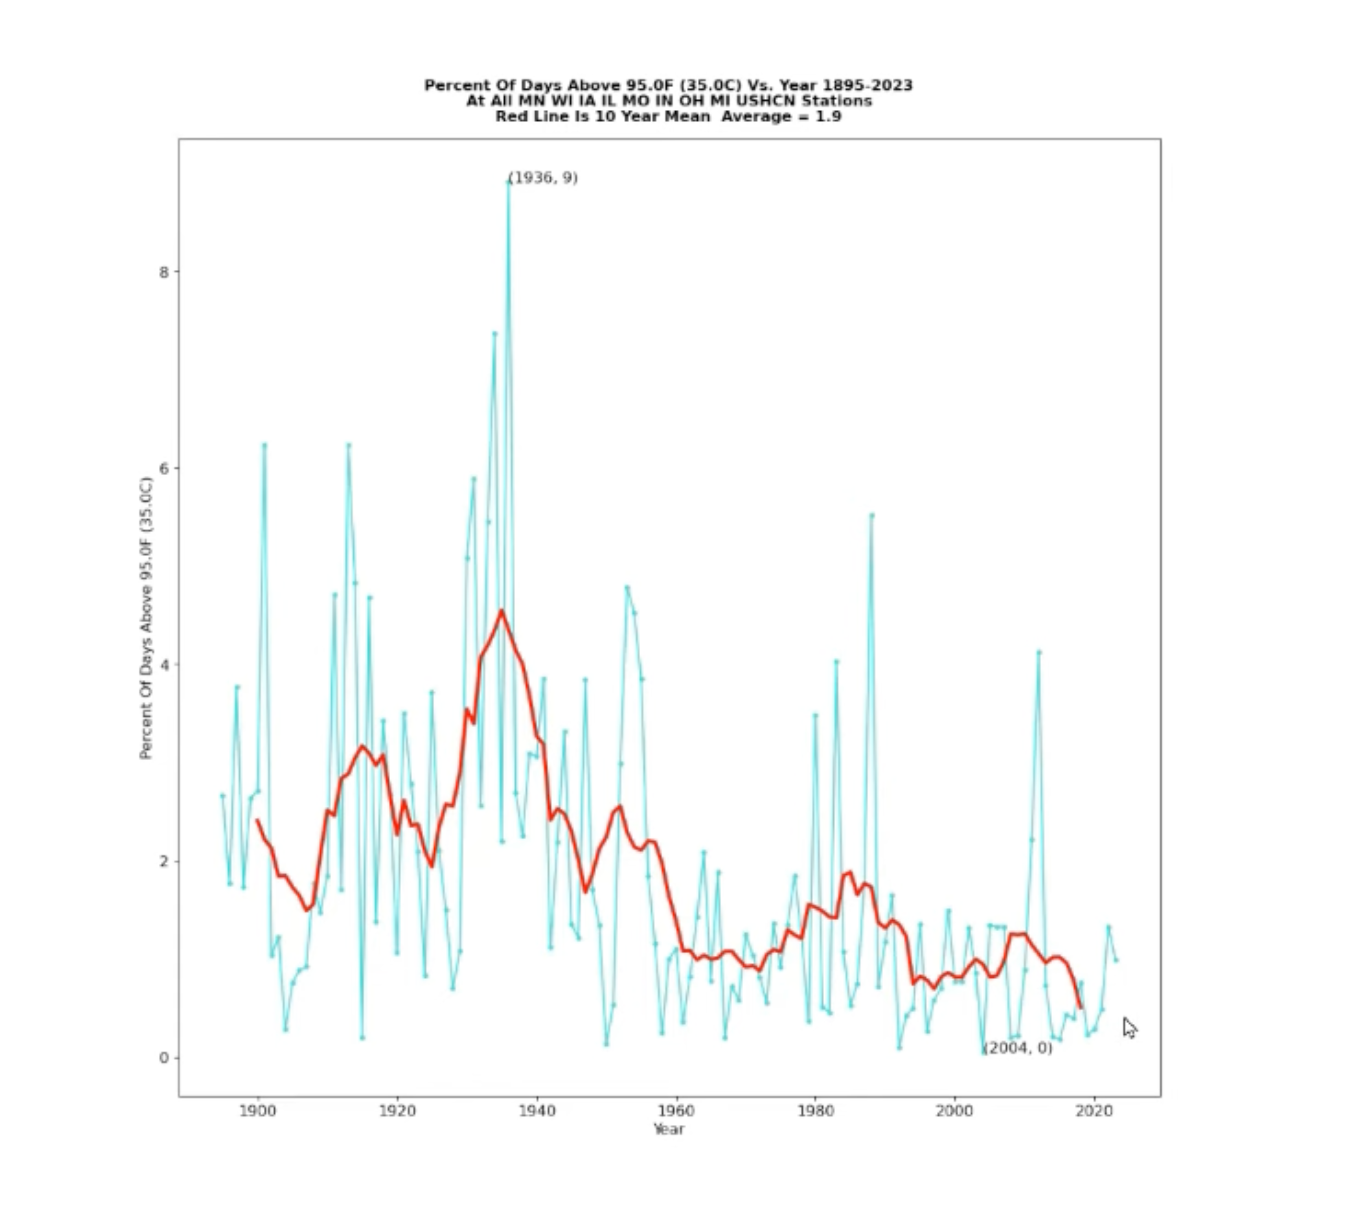
Historical Peaks and Declines
The available data suggests that the percentage of days exceeding 95 degrees Fahrenheit in the Midwest reached its highest point in 1936. Since that year, there has been a notable downward trend in the occurrence of such very hot days, with record lows being reported in recent years. This decline has coincided with an increase in atmospheric carbon dioxide levels.
State-by-State Analysis
An examination of each Midwest state individually reveals consistent trends with the regional pattern:
- Minnesota: A sharp decline in the number of hot days since the 1930s.
- Wisconsin: A plummeting trend in the occurrence of very hot days since the 1930s.
- Iowa: A significant decrease in very hot days.
- Similar downward trends are observed in Missouri, Illinois, Indiana, Ohio, and Michigan.
All the Midwest states have experienced a reduction in the number of very hot days as atmospheric CO2 has risen.
Comparison with National Climate Predictions
The National Climate Assessment's predictions contrast with the observed data, forecasting an increase in very hot days in the Midwest. This discrepancy raises questions about the underlying data and methodologies used for the national climate projections.
Nationwide Temperature Trends
At a national level, the percentage of weather stations recording temperatures of 95 degrees Fahrenheit or higher peaked in 1931 and has since declined to record lows. This trend is also reflected in the frequency of 95-degree days across the lower 48 states, which has dropped since the 1930s.
Climate Extremes Index Discrepancies
NOAA's Climate Extremes Index (CEI) presents a different picture, indicating that summer maximum temperature extremes have risen to record highs. This is contrary to the thermometer data, which shows a sharp decline in summer maximum temperatures.
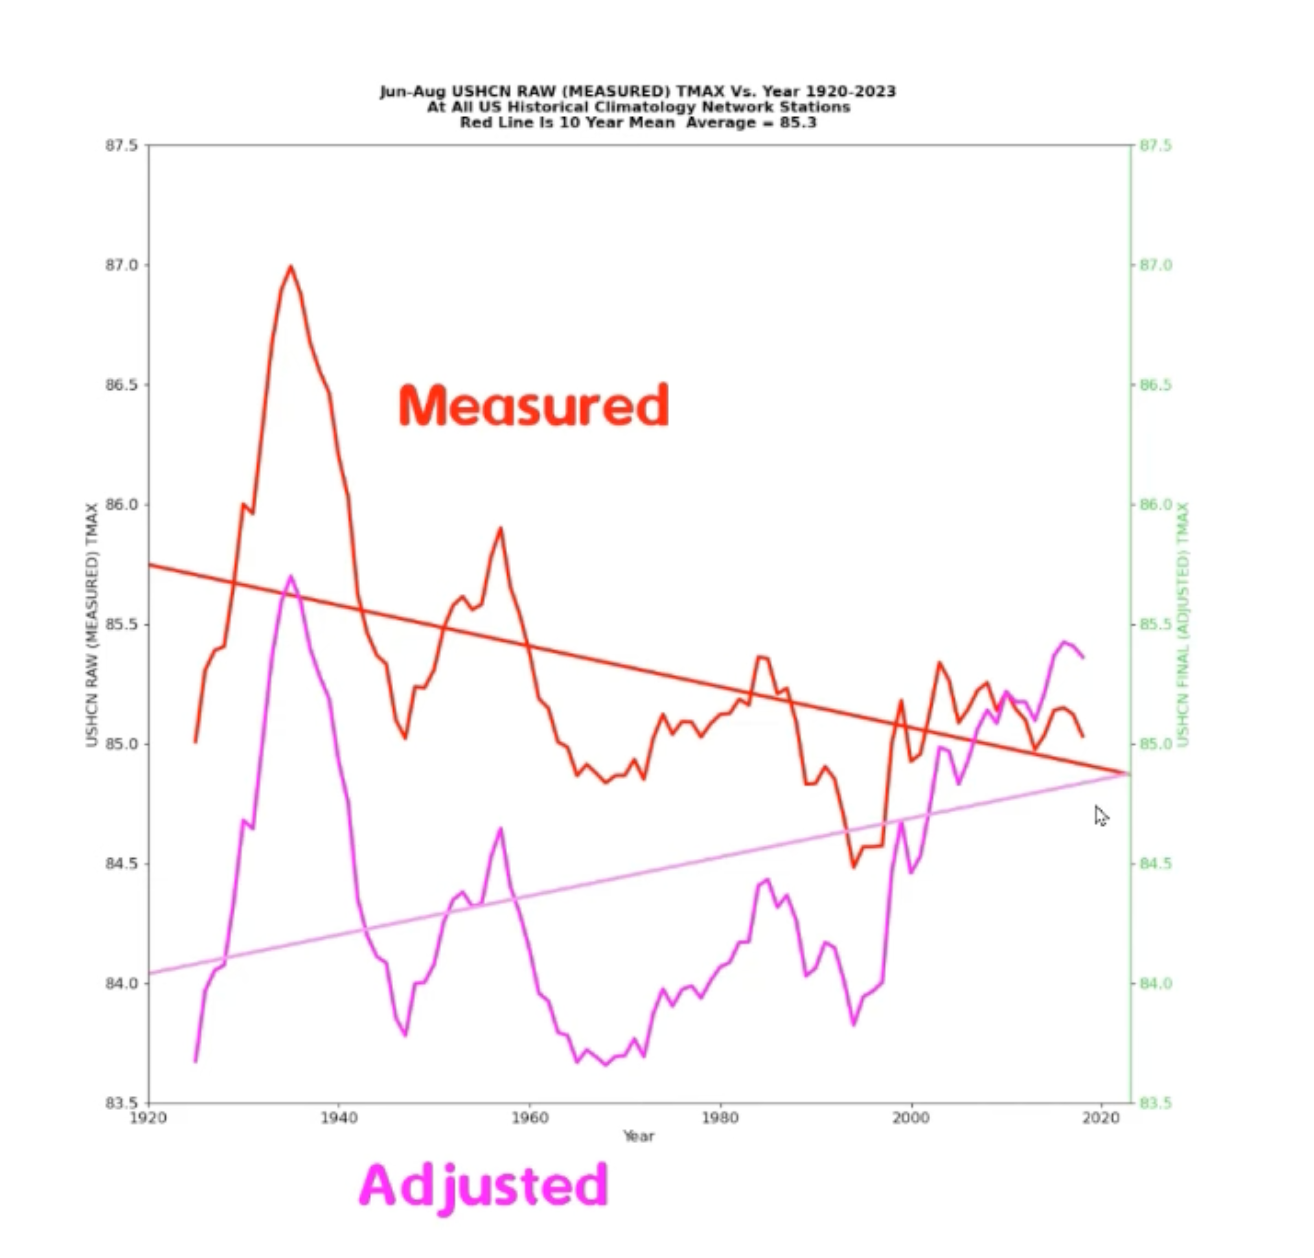
Data Adjustments and Implications
The CEI appears to be based on adjusted data that transforms the declining temperature trend into a warming trend. The legitimacy of these adjustments is called into question, as they seem to contradict the raw thermometer data.
Conclusion
The historical data analysis of temperature trends in the Midwest and nationwide does not support the predictions of increased very hot days made by the National Climate Assessment. The apparent discrepancy between raw temperature data and the adjusted data used in the Climate Extremes Index warrants further investigation to ensure accurate climate modeling and prediction. The contrasts between observed trends and climate projections highlight the importance of transparency and scrutiny in climate science.