A 220-Year Perspective on the S&P 500 Index
Matthew cautions viewers about the complexities of market timing and the necessity of a long-term perspective, particularly when considering the compounded annual growth rate of the S&P 500, which stands at 3.9% per year without reinvesting dividends.


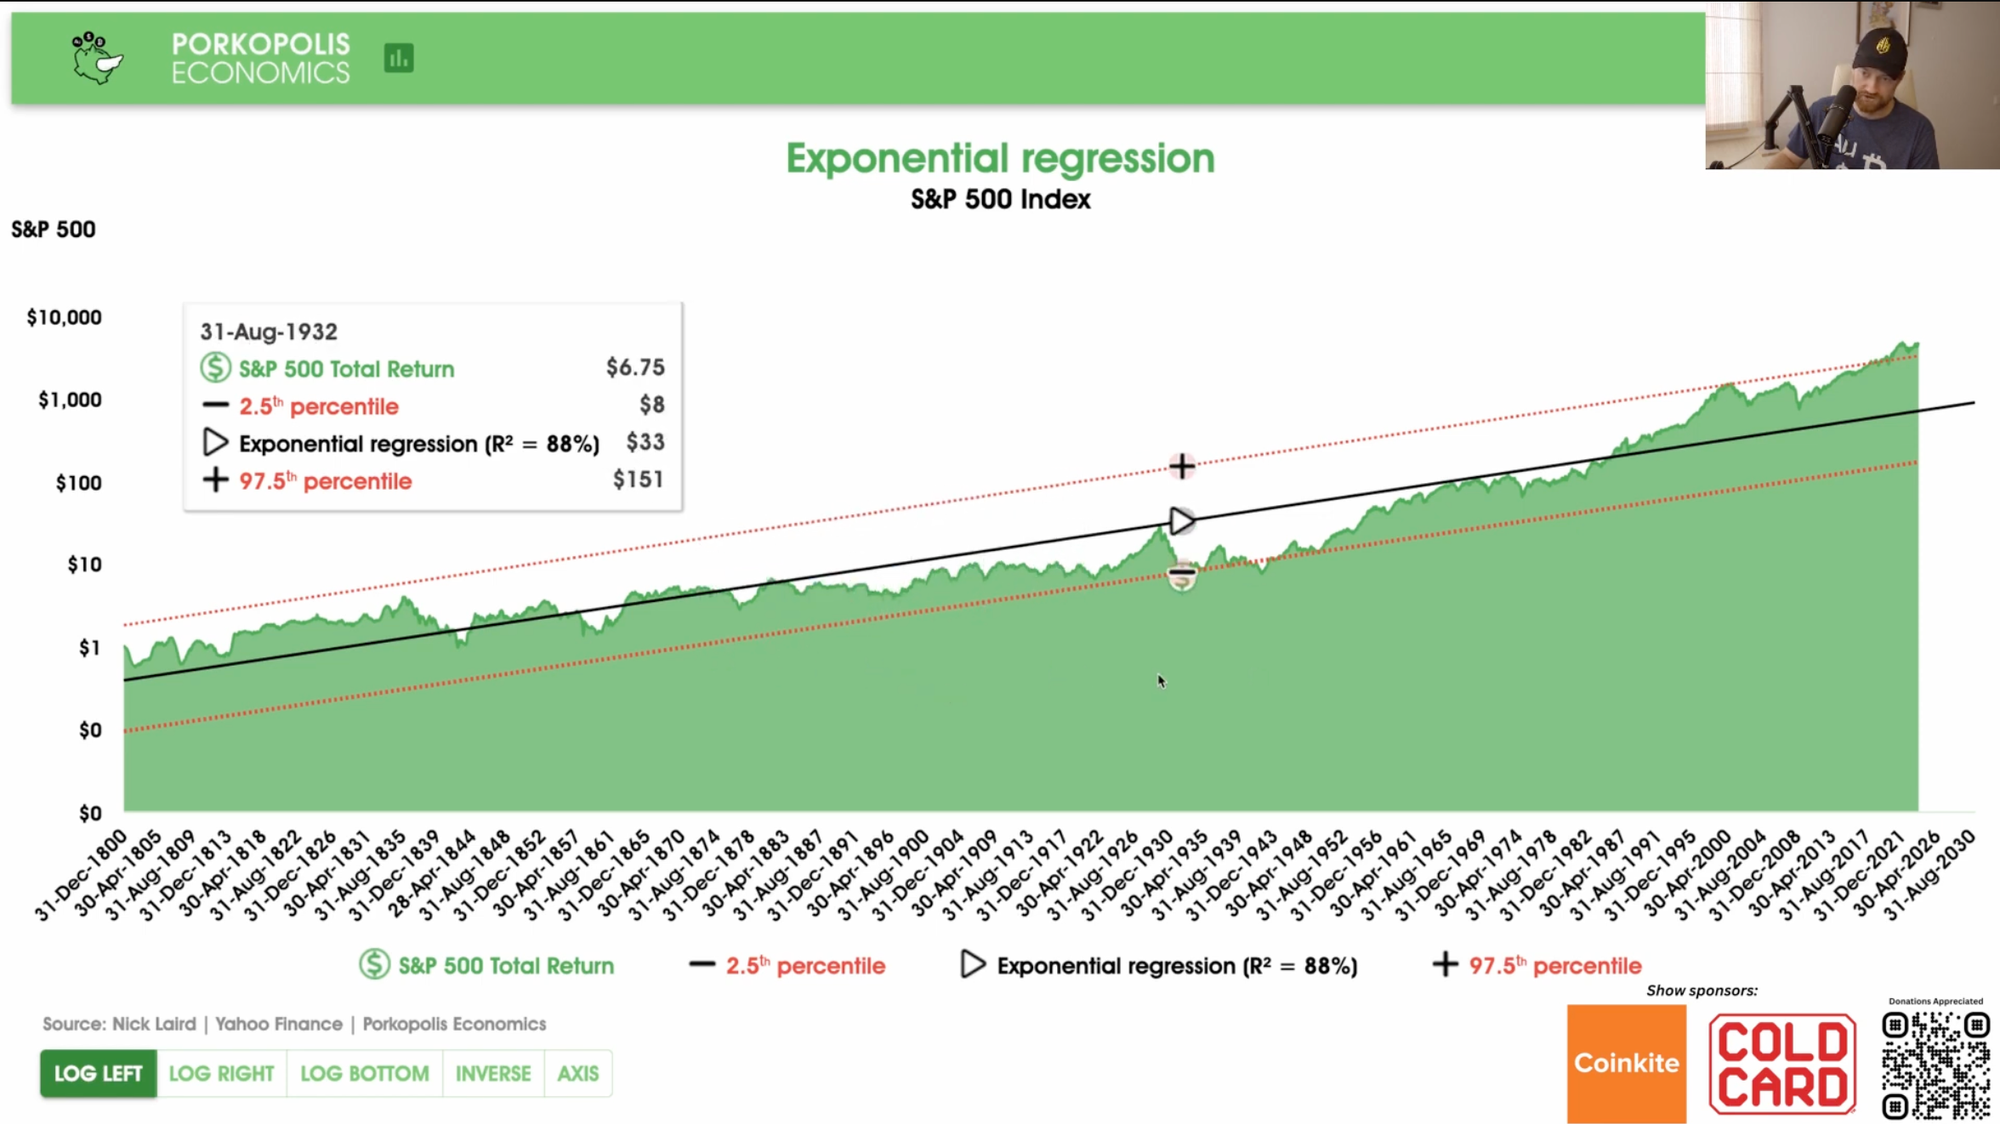
In a video published this morning by Porkopolis Economics, Matthew Mežinskis delved into an expansive historical overview of the S&P 500 index, tracing its evolution over an astonishing 220 years. This comprehensive analysis, which pivots away from the more limited scopes typically seen in financial assessments, offers a unique insight into the long-term performance of the United States stock market.
Matthew begins by establishing the historical backdrop for the New York Stock Exchange, which dates back to before 1792, while the creation of indices such as the Dow and the S&P 500 didn't occur until the late 1800s and early 1920s, respectively. The latter is particularly significant as it marked the beginning of a more systematic tracking of market performance.
The pre-1923 data in the video is based on the compilations by Australian researcher Nick Laird, who meticulously reconstructed an index representing the stock market's performance during those early years. Although the dataset excludes dividends, it provides a rare glimpse into the market's long-term growth trajectory.
Matthew emphasizes the importance of using a logarithmic scale when analyzing such extensive data. This approach reveals the market's exponential growth pattern, a consistent upward trend from the lower left to the upper right on the chart. He points out the market's volatility, noting historical periods such as the Civil War and the Great Depression, during which the market deviated significantly from its long-term trend.
A particularly striking observation is that the S&P 500 did not surpass its pre-Great Depression peak until decades later, underscoring the enduring impact of significant market downturns. The video also highlights how the abandonment of the gold standard in 1971 and subsequent fiat money printing appeared to steepen the market's growth curve.
The analysis concludes that while the stock market inherently exhibits exponential growth, it is also prone to sustained periods of volatility. Matthew cautions viewers about the complexities of market timing and the necessity of a long-term perspective, particularly when considering the compounded annual growth rate of the S&P 500, which stands at 3.9% per year without reinvesting dividends.
This reflection on the grand scale of market history not only contextualizes present-day market performance but also poses critical questions for investors about the true nature of stock market returns over the vast expanse of time.