
It is safe to assume that the government is overtly lying about the true level of price inflation throughout the economy.
CPI Misses across the board:
— zerohedge (@zerohedge) November 14, 2023
CPI 0.0% MoM, Exp. 0.1%,
CPI Core 0.2% MoM, Exp. 0.3%
CPI 3.2% YoY, Exp. 3.3%
CPI Core 4.0% YoY, Exp. 4.1%
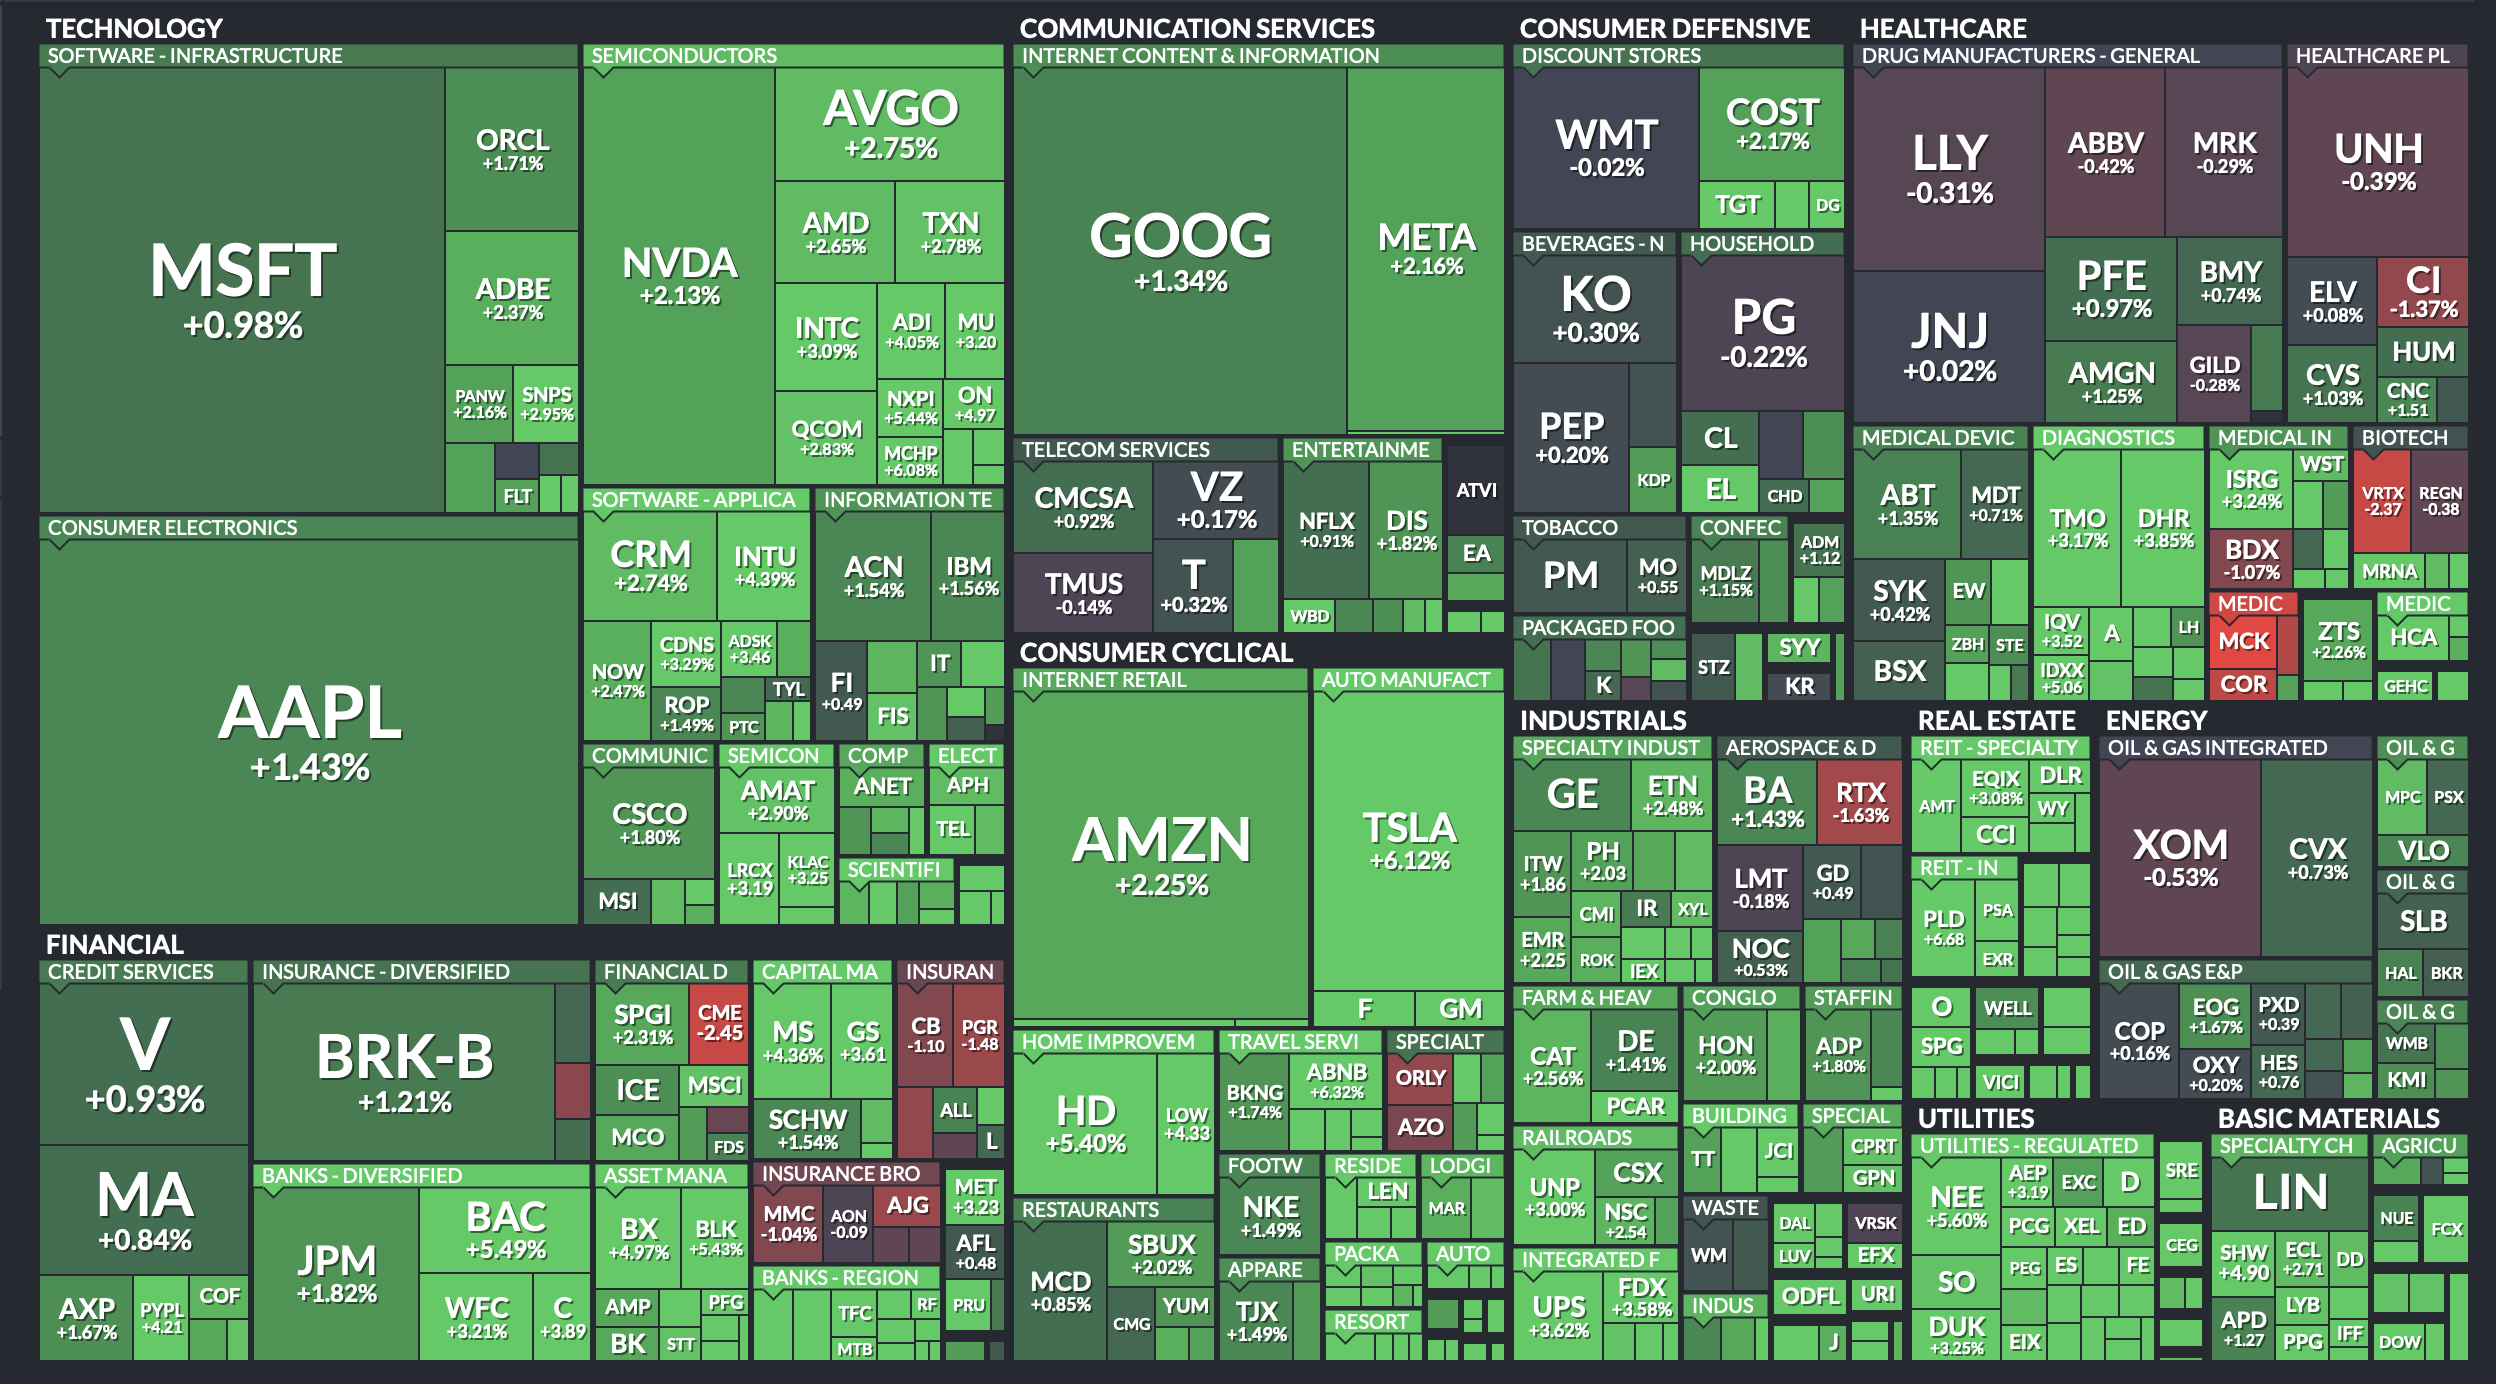
Earlier today the CPI prints for October hit the market and the "official" inflation numbers came in below expectations. This caused markets to rally across the board as the low print was taken as a signal that the Fed is properly taming inflation, which means that the likelihood of a reverse in interest rate policy has increased. A reverse in interest rate policy means that "money printer go brrrr" is back on the table. "Money printer go brrrr" means that there is more liquidity to flow into financial assets and today's stock market moves can be seen as a type of front running based on these assumptions.

This all seems well and good until one actually dives into the data underlying the CPI print, which is exactly what Chris Martenson did earlier this afternoon. If you want to understand what is actually happening underneath the hood of the CPI calculation I highly recommend you take the six-and-a-half minutes to watch the video from Chris below.
The #CPI was another pack of easily exposed lies. For example, the BLS claims that health insurance costs are down -34% over the past year. 🤡🌎
— Chris "Context Matters" Martenson, PhD (@chrismartenson) November 14, 2023
Here's a quick video on the subject. Please share this with anyone who might need to see this. pic.twitter.com/cX8NMH6Bti
As Chris points out, for one to believe the CPI number is accurate they would have to believe that their average grocery bill has only risen by 3.2% since October of last year. I have made many trips to the same grocery store I've been frequenting for years and I can assure you that the government numbers are a laughable lie. It's pretty safe to say this is what most individuals' experience at the cash register of the grocery store is like this days.
What it's like going grocery shopping these days: 😂
— Wall Street Silver (@WallStreetSilv) November 10, 2023
🔊 … this is so true it’s both hilarious and sad to watch.
When grocery shopping these days, are you shocked at how little you get these day? pic.twitter.com/OIlf3mbhB1
One of the more egregious data points that Chris highlights in his analysis is health insurance costs, which the government is claiming have fallen by more than 30% since this time last year. All one has to do is look at the disability stats in the US over the last few years to deduce that this is pure data manipulation.
Hoping for the downtrend but if this was a stock I would buy more on the back test of the break out. pic.twitter.com/g0gHJc2nbV
— Edward Dowd (@DowdEdward) November 14, 2023
If the amount of disabled Americans older than 16 has increased by more than 10% since 2020, it is safe to say that the aggregate healthcare expenses have gone up considerably, which forces people to draw on their insurance plans, which raises prices for everyone else.
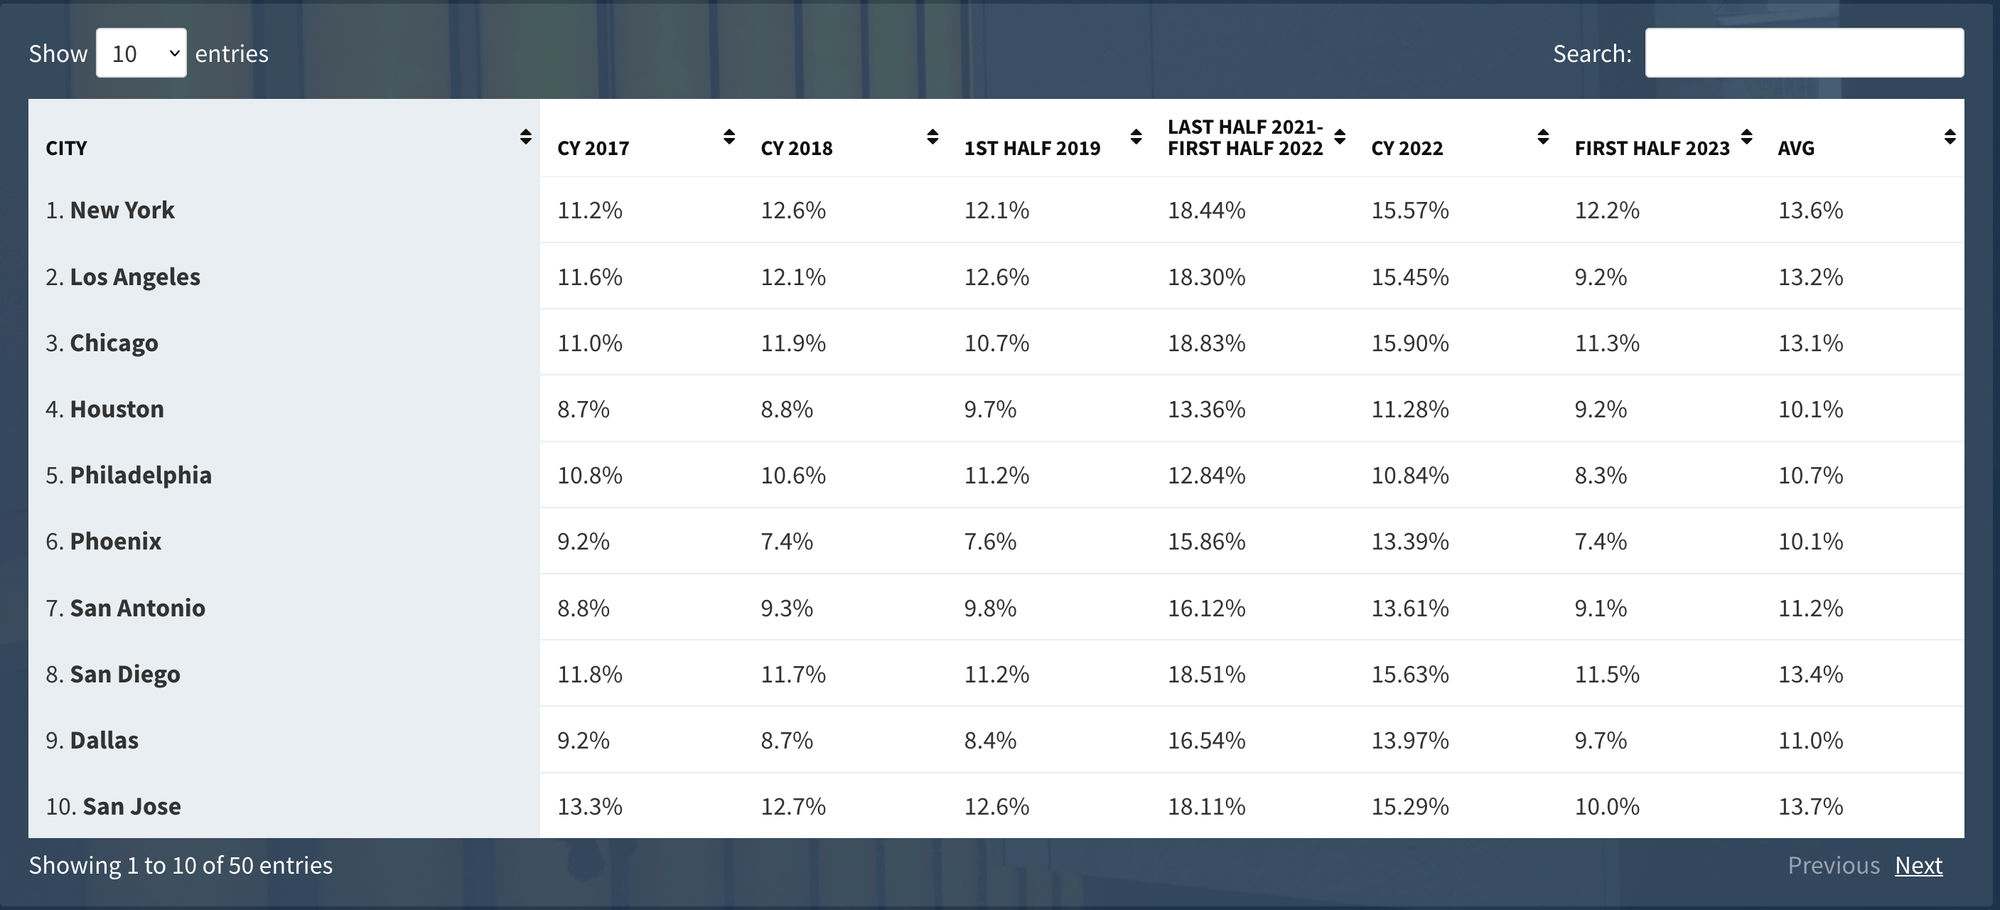
These are but a few examples that were highlighted in Chris' breakdown. It is safe to assume that the government is overtly lying about many other goods and services that make up the CPI. For a more accurate representation of price inflation in the economy I recommend you use the Chapwood Index, which actively tracks a basket of 500 goods and services across 50 cities in the United States with data being crowdsourced on a semi-annual basis using actual receipts. If you look at the Chapwood Index you'll see that real price inflation is 2-3 times higher than what the BLS is reporting.

Long story, short; the government is openly lying to you so that they can use their bad data to justify more money printing. The result of all of this is a complete detachment from reality that will lead to more suffering for the Common Man.
Final thought...
Road dogging it the last few months. Ready for Thanksgiving.


