


Utilizing statistical trendline analysis, particularly a power law trendline, gives insight into Bitcoin's price behavior over time.
The evolution of Bitcoin's price since its inception has been a subject of intense scrutiny and analysis. With its price history dating back to May 22, 2010, known as Bitcoin Pizza Day, the cryptocurrency has undergone significant volatility and growth. Utilizing statistical trendline analysis, particularly a power law trendline, gives insight into Bitcoin's price behavior over time. This analysis examines the historical price data of Bitcoin, its fluctuations, and establishes a probabilistic framework for understanding its past and potential future price movements within certain statistical boundaries.
The Bitcoin price history is punctuated by the first recognized Bitcoin barter transaction: 10,000 bitcoins for two pizzas on May 22, 2010. This transaction has become a milestone in Bitcoin's journey and is an anchor point for its price analysis. When examining the long-term price trends of Bitcoin, various statistical trendlines can be applied to its price history, including linear, logarithmic, exponential, and power law trendlines.
Among these options, the power law or power regression trendline is the most fitting. A power law trendline on a logarithmic scale indicates rapid early growth that gradually tapers off, appearing asymptotic towards the end. Even when viewed on a linear scale, where it still appears exponential, the power trendline differs from a pure exponential curve. The power law trendline fits the Bitcoin price data with a high degree of accuracy, boasting a 95% R-squared value.
This statistical approach also incorporates the use of percentile bands, essentially standard deviation bands, which create a visual representation of where Bitcoin's price has historically fallen on any given day. These bands provide a probabilistic estimate of where we might expect the price to be in the future. Specifically, the one standard deviation band indicates that Bitcoin's price will fall within this range two-thirds of the time, while the two standard deviation or 95 percentile band suggests that 95% of Bitcoin's price data will fall within these wider bounds.
Historically, Bitcoin has experienced significant price peaks, such as in 2011, 2013, and 2017, where the price reached two standard deviations above the trendline. These instances were considered extreme moves at the time. However, the double tops observed in 2021, where Bitcoin exceeded $60,000, were only one standard deviation moves, indicating a less extreme deviation from the trend.
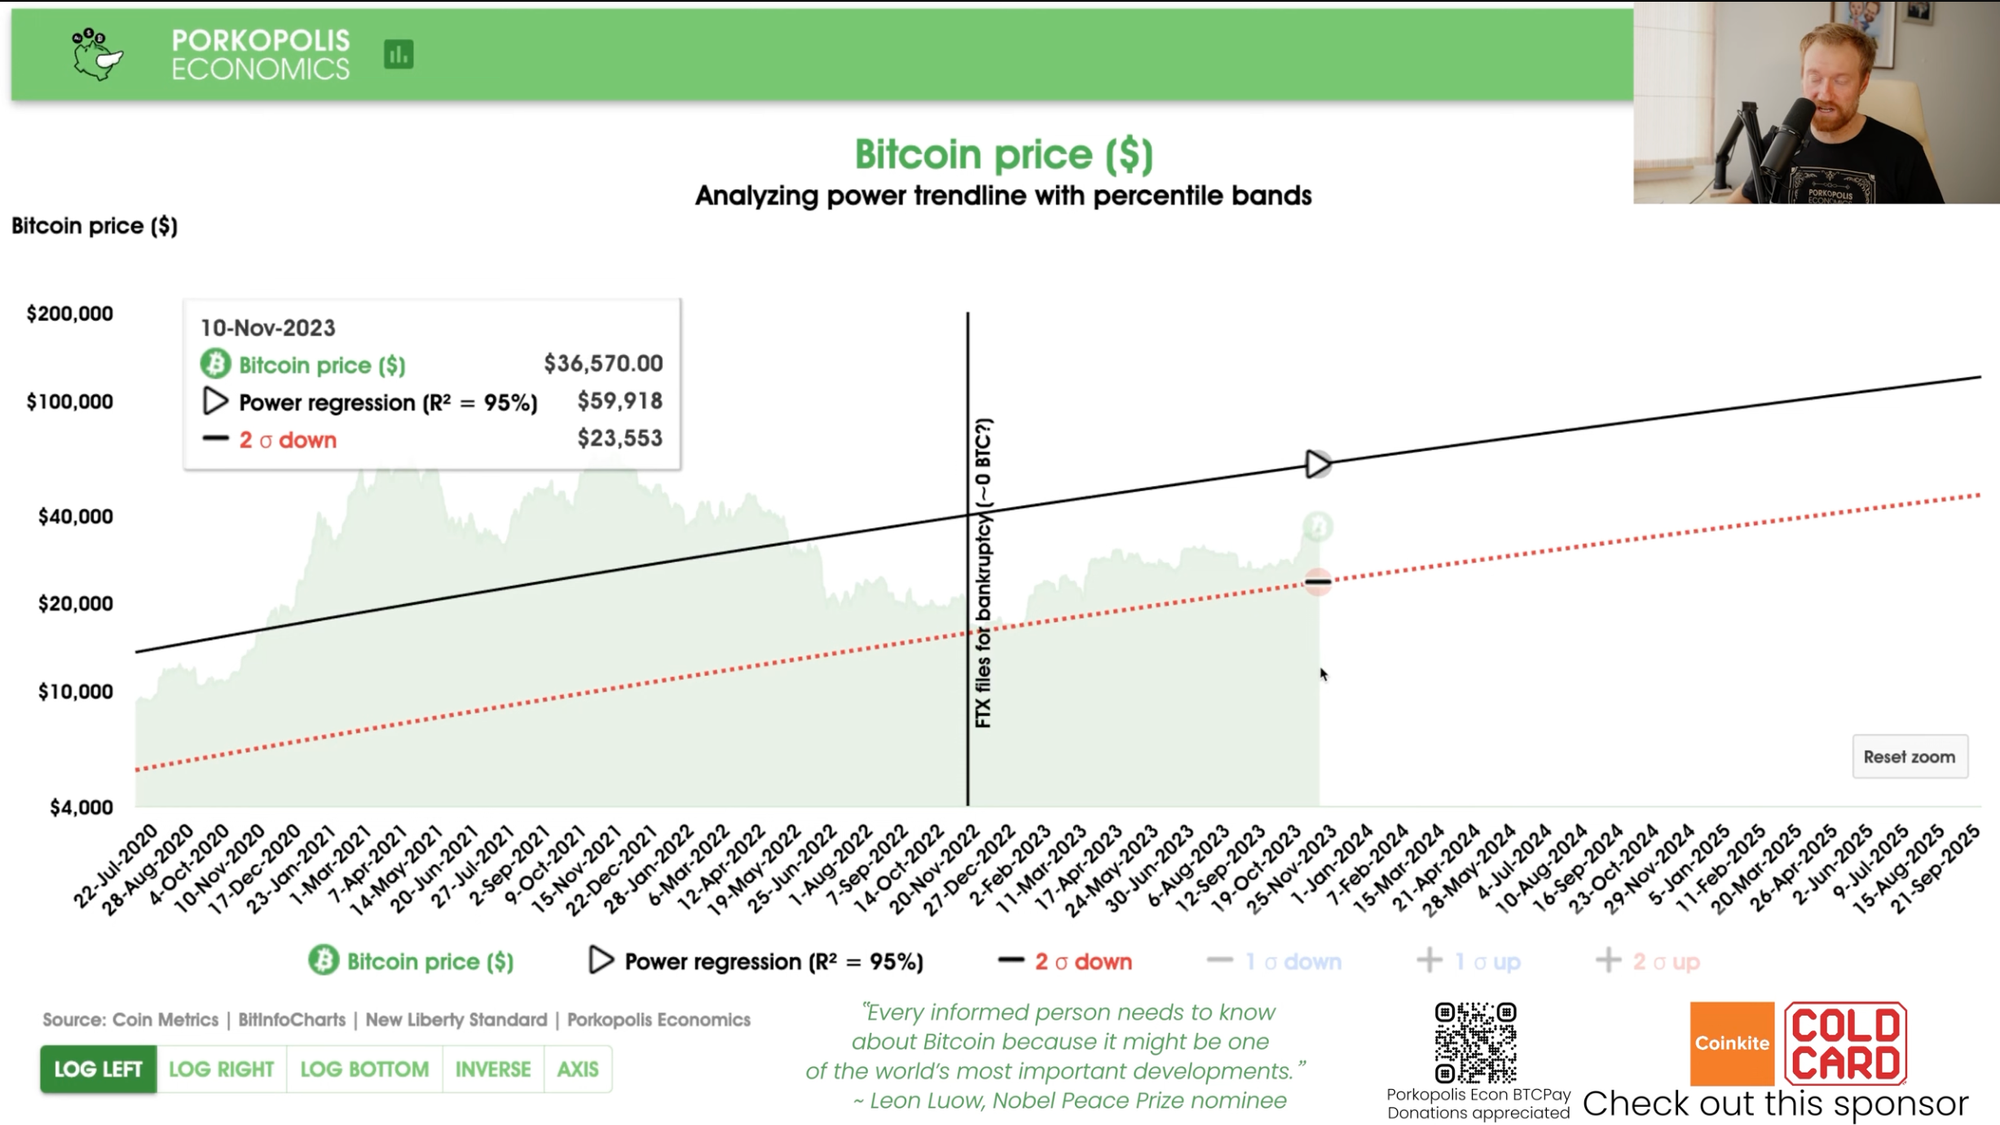
The analysis also recounts the impact of various crises on Bitcoin's price, including the "scam coin" crises in mid-2022 and the FTX bankruptcy in November 2022, which saw Bitcoin's price drop significantly. At one point, the price fell to about $16,000 to $17,000 per Bitcoin in December 2022, touching the two standard deviation band, an event statistically expected to occur only 5% of the time. Despite this, Bitcoin demonstrated resilience, bouncing along the two standard deviation band and subsequently recovering.
In March 2023, amid a banking crisis, Bitcoin's price rallied from its lows, reaching $30,000 mid-year, later retracting to around $25,000, and then climbing to approximately $36,570 per Bitcoin at the time of this analysis. This price puts Bitcoin within the one standard deviation band, suggesting that it is within the normal range of historical price movements.
Looking ahead, the trendline projects that if Bitcoin were to experience a major bull run, reaching two standard deviations above the current trend would place its price at a staggering $394,000 per Bitcoin, an exceedingly rare occurrence. Projecting out to 2030, the trendline estimates a Bitcoin price around $600,000, although this is subject to daily adjustments based on incoming data.


