
Bitcoin's market cycle can be intricately understood by examining on-chain metrics, such as liveliness, and the impact of Bitcoin halving events.
The analysis of Bitcoin's market cycle through on-chain and cycle analysis offers a fresh perspective on the cryptocurrency's supply dynamics and the market's psychological patterns. By examining the bitcoin blockchain from its inception to the present day, various on-chain metrics such as liveliness and the behavior of Bitcoin holders (Hodlers) provide insight into the active and non-participating supply, which in turn affects Bitcoin's price discovery. Additionally, the interplay between the diminishing new supply issuance due to Bitcoin halving events and the growth rate of illiquid supply has significant implications for the available supply for trade. In this article, we dissect these factors and explore how they might influence future market cycles, particularly in the context of the four-year cycle pattern associated with Bitcoin’s halving events.
Bitcoin's market cycle can be intricately understood by examining on-chain metrics, such as liveliness, and the impact of Bitcoin halving events. Liveliness, a metric that increases when old coins are spent and signifies a high level of market activity, reveals the periods when long-held coins re-enter the market. This can be contrasted with periods of low market activity, where coins remain unspent and liveliness is low.
The circulating supply of Bitcoin is currently around 19.5 million coins, with a hard cap of 21 million coins, which will be mined over the next century. Each halving event, occurring every 210,000 blocks, significantly reduces the rate of new supply issuance - a critical factor in Bitcoin's deflationary model. The circulating supply can be divided into active supply, responsible for price discovery, and non-participating supply, which includes lost coins and those unlikely to move, such as those owned by Satoshi Nakamoto.
Zooming into the active supply, we see it is reduced to approximately 12 million coins. This supply is further distinguished by liquidity levels, with the Hodlers’ behavior playing a key role. Hodlers, long-term holders of Bitcoin, can be classified into two categories based on their spending behavior: illiquid (those who spend less than 25% of their holdings) and liquid. Illiquid supply tends to grow linearly over time and outpaces the new supply issuance, which diminishes with each halving.
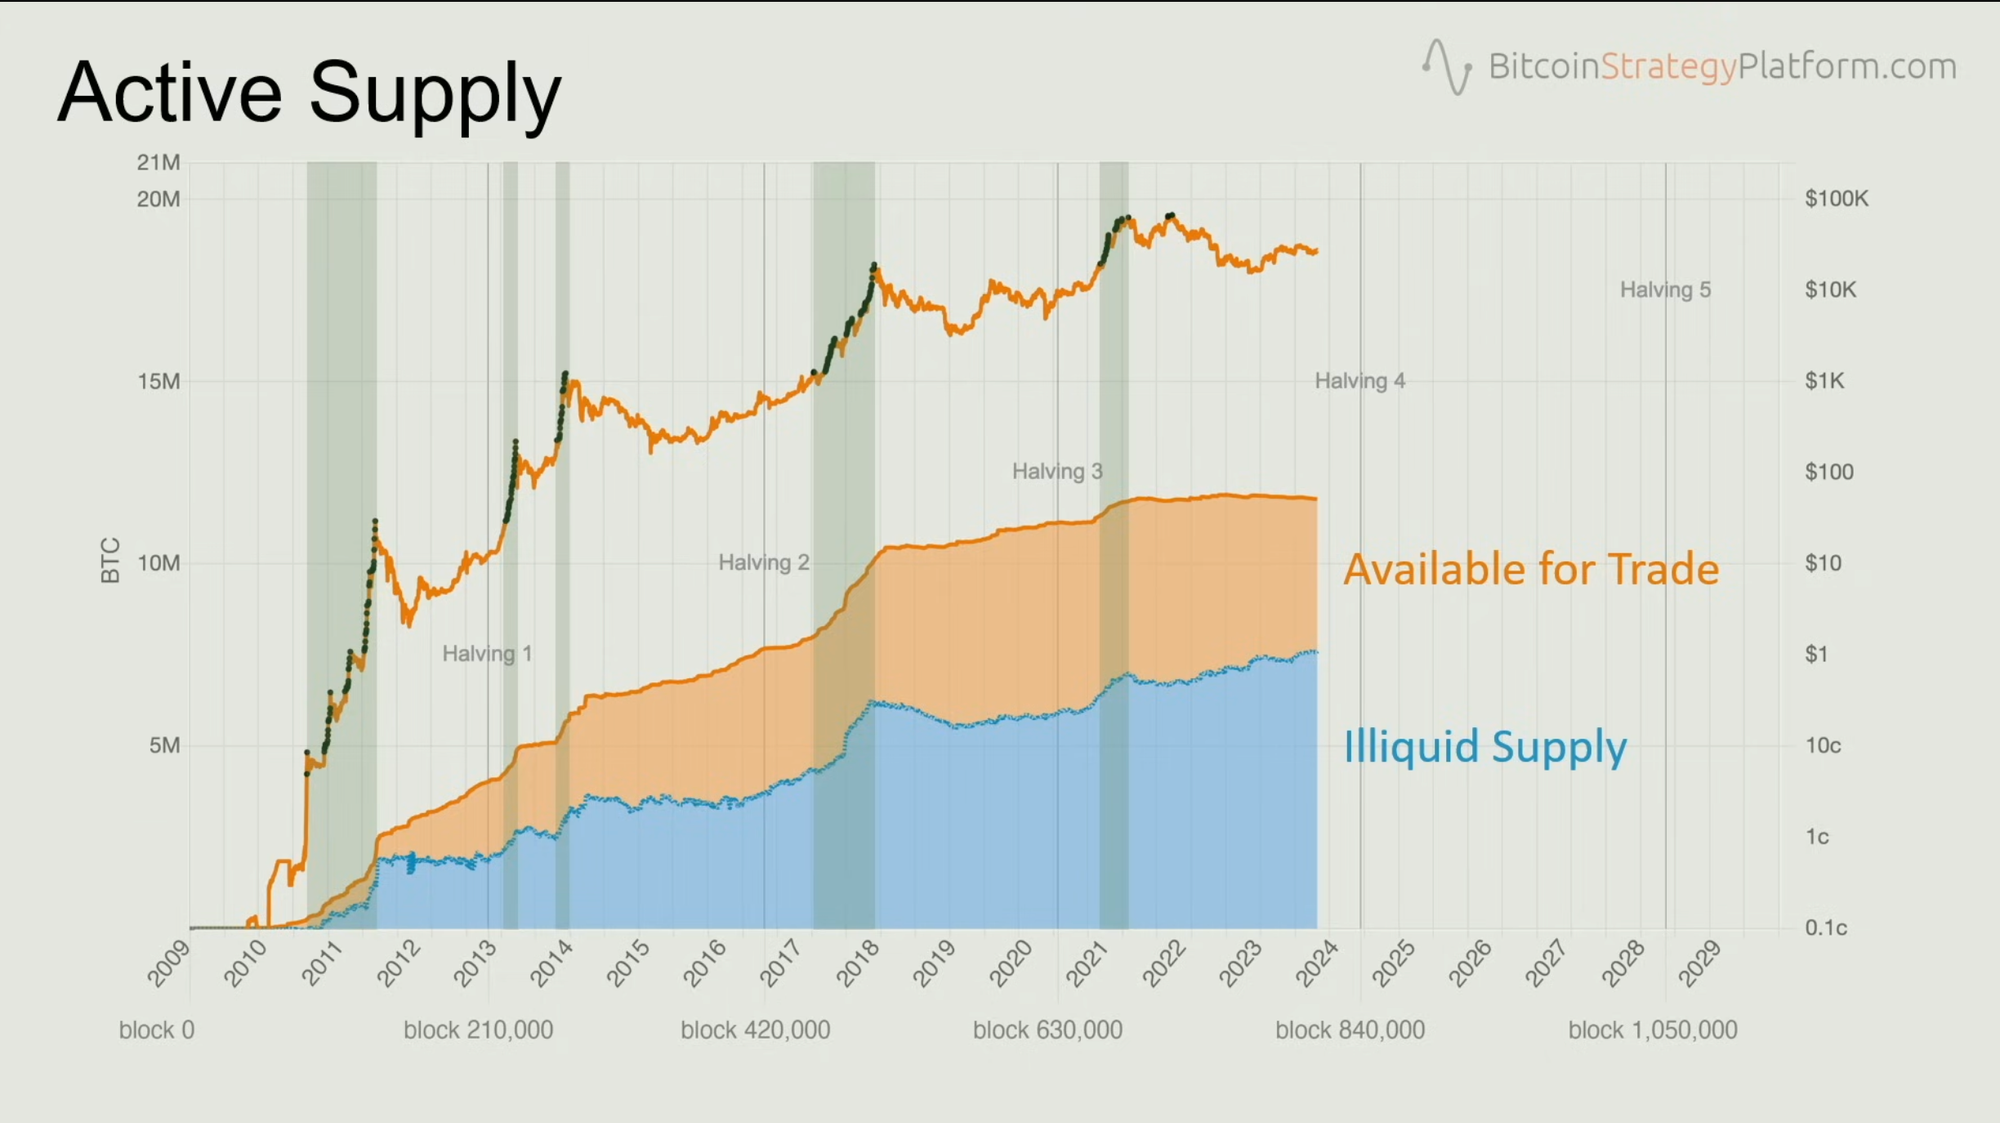
During bull markets, when Bitcoin's price increases exponentially, old coins are more likely to be spent, causing spikes in the liquid supply. However, new demand often absorbs this selling pressure, initially marking the bought-up supply as illiquid. After the bull run, new entrants sensitive to price changes may sell, increasing liquidity. Despite these fluctuations, the overall trend for illiquid supply remains linearly upward.
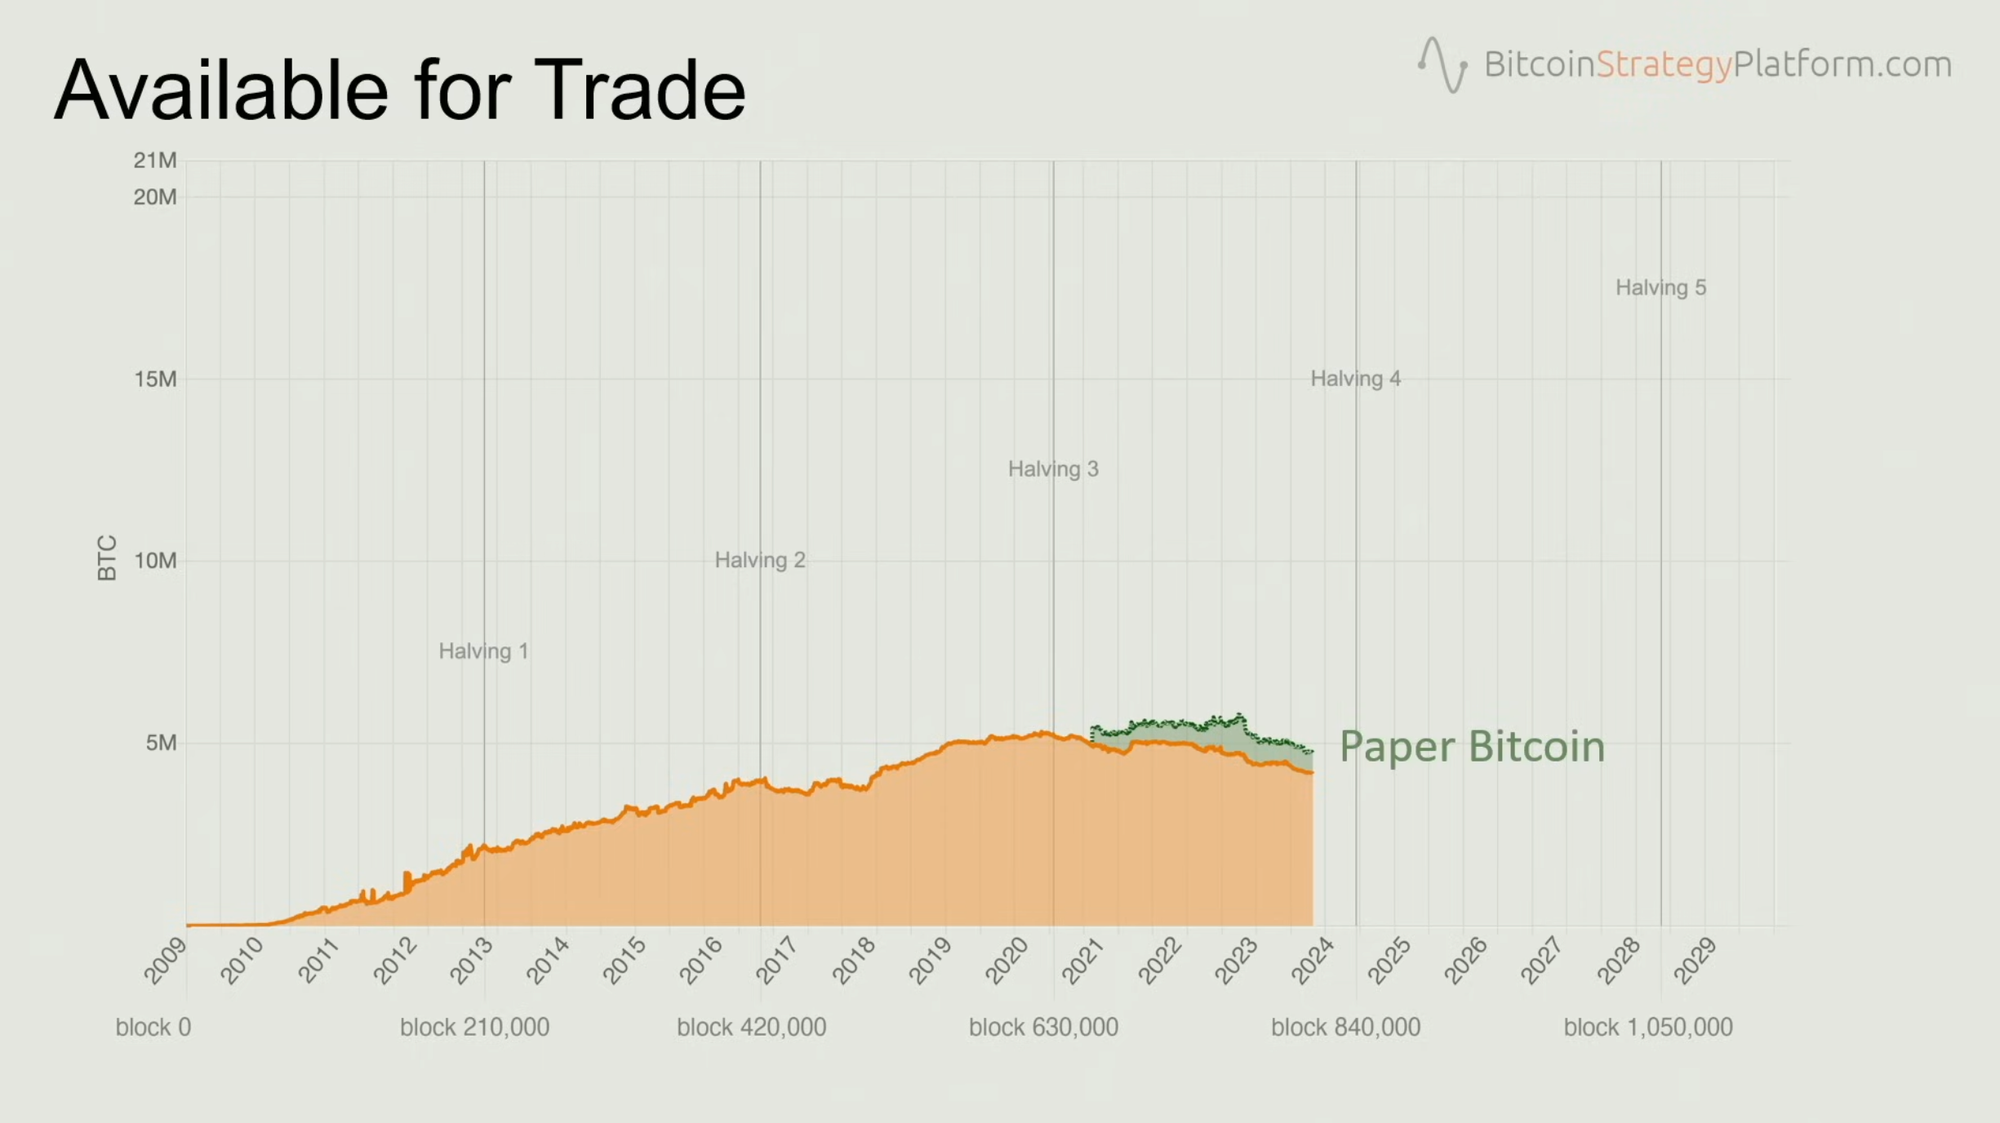
Since the third halving, the available supply for trade has been shrinking. This is logical, considering the growth rate of illiquid supply surpasses the rate of new coin issuance. However, a supply shock has not been evident due to several factors. Firstly, the maximum available supply for trade has historically been around 5 million coins, and the current supply isn't far from that level. Secondly, the introduction of fiat-like practices through derivative markets allows traders to speculate on Bitcoin without the need for underlying coins, thereby diluting the impact of a reduced supply on price. Lastly, supply is truly tested only once per cycle, during the hype phase, and since the last bull run in 2021, we've witnessed a high available supply for trade, coupled with extensive paper Bitcoin trading.
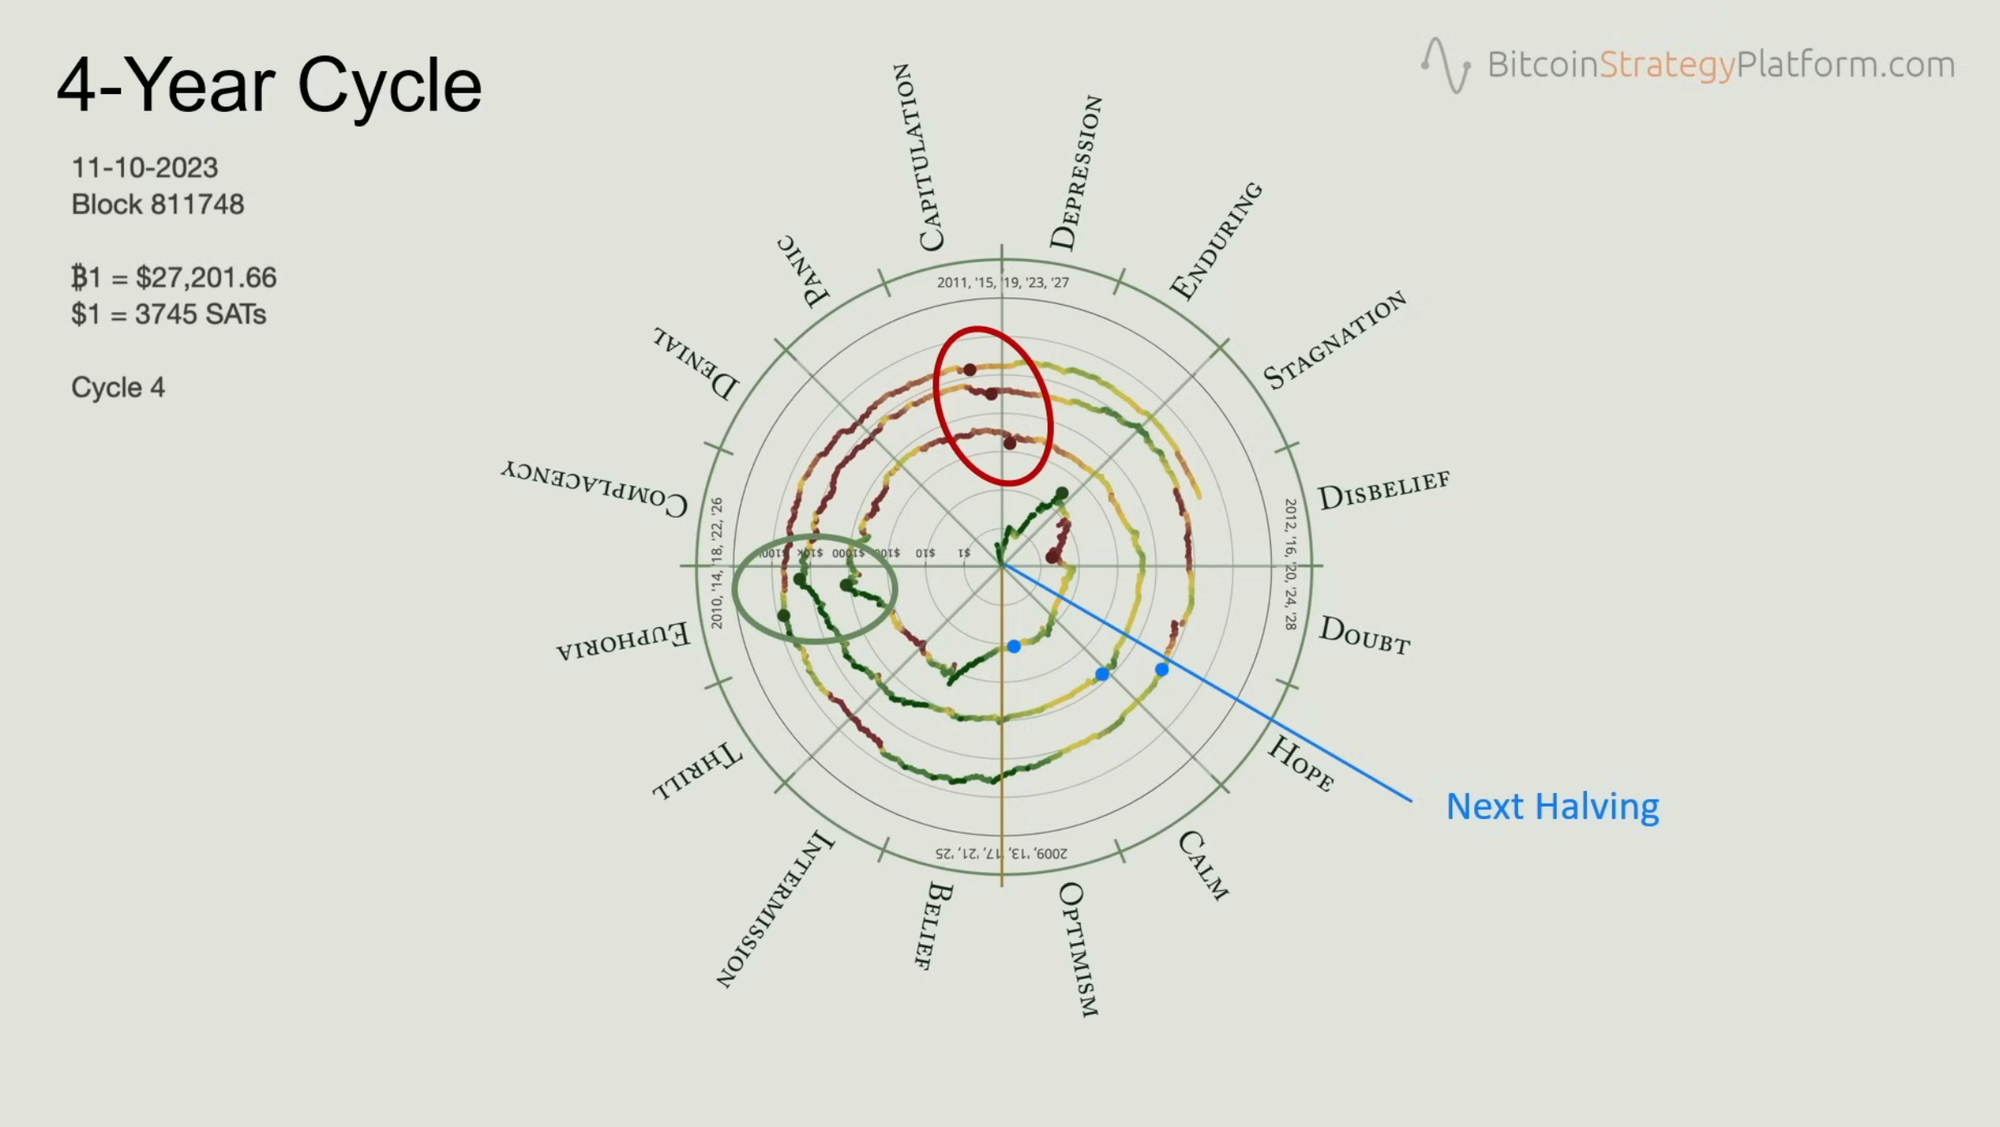
Looking ahead, the next halving at block 840,000 is anticipated to be a significant test for the reduced supply. The market cycle's psychology, as depicted in the Wall Street cheat sheet, suggests that each phase of the cycle – from euphoria to depression and back – corresponds with the behavior of short-term holders, who are more sensitive to price movements. By analyzing the average purchase price of these holders, we can gauge the market sentiment and its potential future trajectory.
Bitcoin's four-year cycle, influenced by the halving events, can be visualized on a circular chart, with each rotation representing a four-year period. The chart reveals a pattern of peaks and troughs coinciding with the cycle's stages. The current phase, leading up to the next halving, is characterized by disbelief and doubt, with hope expected to return post-halving. If the pattern holds, the next euphoria phase is likely to occur towards the end of 2025.