Diesel Fuel +24% Pushes August PPI to +5.4% YoY, Rate-Hike Odds Rise
August PPI came in at +0.4% MoM and +5.4% YoY, driven by a 24.1% monthly surge in diesel fuel prices. With the September 16 FOMC meeting six days away and CPI printing tomorrow, the data pipeline feeding into Core PCE is heating back up.
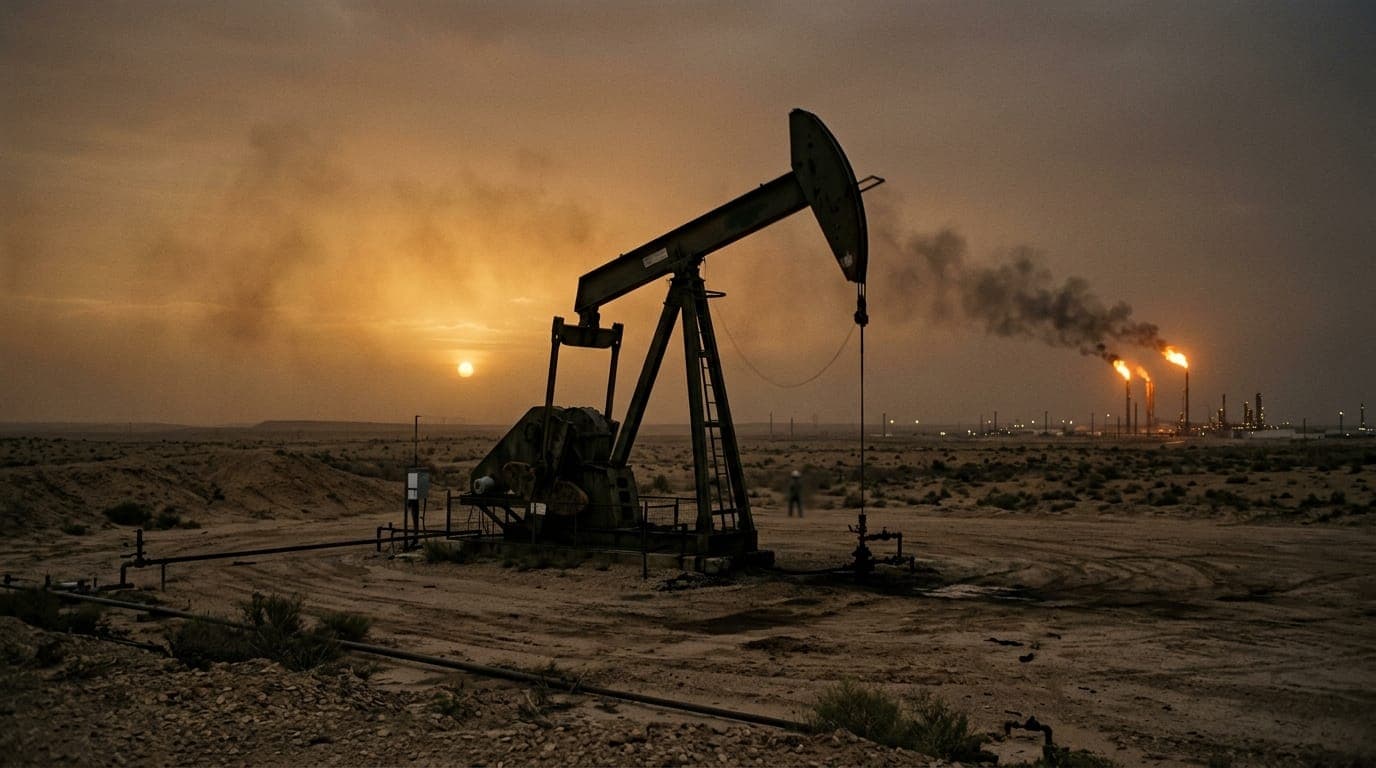
August's energy re-inflation just blew a hole in the soft-landing narrative, six days before the Fed decides.
Key takeaways
- The BLS reported August headline PPI at +0.4% MoM and +5.4% YoY, with diesel fuel jumping 24.1% in a single month, per USDL 26-1495.
- CME FedWatch now prices roughly a 60% probability of a 25 bp hike at the September 16 FOMC meeting, up sharply from pre-Jackson Hole levels when markets leaned toward a hold.
- August CPI prints tomorrow at 8:30 a.m. ET. If it confirms the energy pass-through, a Fed caught between sticky inflation and $36 trillion in outstanding debt has no clean exit.
The Bureau of Labor Statistics released the August Producer Price Index this morning, and the number that matters most isn't the headline: it's diesel fuel, up 24.1% in one month. That single line item accounted for over a third of the entire increase in final demand goods, and it's the kind of cost-push shock that doesn't stay in the PPI column for long.
Headline PPI final demand came in at +0.4% MoM (July was revised up to +0.1% from the initially reported flat read). Year-over-year, headline PPI now sits at +5.4%, hotter than consensus.
What the Data Actually Shows
Energy flipped from deflationary to re-inflationary in August. PPI final demand energy rose 4.2% MoM, reversing two consecutive months of declines. Beyond diesel, gasoline, jet fuel, and home heating oil all advanced.
PPI final demand goods rose 1.1% MoM, the largest monthly increase since May. Services were quieter at +0.1% MoM, though transportation and warehousing jumped 2.3%, with truck freight specifically up 2.0%.
Core PPI (ex-food and energy) came in at +0.2% MoM, a tick below the +0.3% consensus estimate. Core PPI YoY landed at +4.6%, in line with expectations. The "super-core" read (less foods, energy, and trade services) ran at +0.3% MoM and +4.7% YoY.
The services side of the ledger offered some relief. The goods side did not.
The Pipeline Into PCE
PPI isn't the Fed's target, but it feeds the one that is. Specific PPI services components, including healthcare, transportation, legal services, and portfolio management, flow directly into the Personal Consumption Expenditures deflator, which is what the Fed's 2% target is benchmarked against. Fed Chair Kevin Warsh flagged PCE at 3.7% over 12 months and "a little above four" over 6 months at Jackson Hole on August 28, per the speech transcript. Both figures are well above target. A diesel-led goods surge in PPI raises the floor for where PCE lands next.
That matters for the September 16 FOMC decision. Three FOMC members dissented in favor of a hike at the July 28-29 meeting, when the Fed held. CME FedWatch now prices roughly 60% odds of a 25 bp hike at next week's meeting, with Kalshi at approximately 57% and Polymarket closer to 49%. Barclays has publicly projected two more hikes this year, September and December, totaling 50 bp.
The hike case is not airtight. The August employment report showed job losses, which is the clearest argument for a hold. That's also why this is still roughly a coin flip rather than a foregone conclusion.
The Stagflation Trap
Here's the second-order problem the rate-hike debate obscures. The U.S. government is rolling over trillions in short-duration debt this year against a backdrop of roughly $36 trillion in total outstanding obligations. Every 25 bp hike adds directly to the interest bill on new issuance. Hiking into an energy-driven inflation spike doesn't kill the inflation, it doesn't fix diesel prices, but it does compound the debt service burden on a sovereign balance sheet that has no margin for error.
That's the stagflation dynamic: the Fed can't hold without losing credibility on inflation, and it can't hike without tightening the screws on a government that is already paying record interest on its debt. Neither path closes the debasement loop cleanly. This is precisely the environment Ray Dalio described when he wrote that Bitcoin and gold would "do relatively well" as U.S. debt grows. The Warsh Fed is living that scenario in real time.
Diesel at +24.1% MoM is not an abstraction. Every good moved by truck reprices. Food, building materials, manufactured goods. Cost-push inflation of this kind hits consumers before it shows up in the Fed's preferred models, and it's not the kind of inflation that rate hikes cure.
The falsifiable thesis: this is not a one-month blip but the energy feedback loop confirming the soft-landing window has closed. That thesis breaks if tomorrow's August CPI prints materially below expectations, say, headline flat or negative MoM, core at or below +0.1%, and oil reverses sharply. If both of those happen and the Fed holds September 16, the transitory-energy-spike framing regains traction. Watch those three variables.
What to Watch Next
August CPI prints tomorrow, September 11, at 8:30 a.m. ET per the BLS release schedule. If CPI confirms the energy pass-through, the 60% hike odds on FedWatch will move higher before the September 16 FOMC decision. This is also a Summary of Economic Projections meeting, meaning the dot plot updates alongside the rate decision. The dot plot will matter as much as the hike-or-hold call itself, it will tell markets whether the Warsh Fed sees one more hike after September or a pause. The combination of PPI, CPI, and the dot plot over the next seven days is as data-dense a stretch as the Fed calendar gets.
Update, September 28, 2026
The Hormuz standoff has now broken the bond market in a way that changes the political calculus around the Fed. With Trump officially rejecting Tehran's latest proposal, Brent crude has surged back toward the $107 level , and the Treasury market is absorbing the damage. The 10-year yield has climbed to 5.196%, its highest since 2007, while the 30-year bond hit 5.4816%, the highest since 2004.
That yield explosion has pushed Bessent into the open. The Treasury Secretary is now publicly lobbying the Fed for relief, urging policymakers to keep an "open mind" on rates. It is a remarkable posture: the man responsible for financing $36 trillion in U.S. debt is asking the central bank to go easy right as energy-driven inflation is the explicit reason rate-hike odds are rising. The Treasury has already moved to at least double its longer-dated bond buyback operations, from $2 billion to $4 billion per operation, running through November 4 , a move that reads as an attempt to cap long-end yields through the back door.
With oil knocking on $110 and the 10-year breaking multi-decade highs, the math is doing the talking louder than any jawboning can. Wells Fargo chief equity strategist Ohsung Kwon wrote that oil "has been in the driver's seat for both stocks and bonds." The policy bind the original PPI data sketched out has now arrived in full: a Treasury secretary begging for rate relief at the exact moment that an energy shock is giving the Fed every reason to hike. There is no clean move here.
Sources
Frequently Asked Questions
Does a hot PPI print guarantee a Fed rate hike on September 16?
Not on its own. PPI is an input into the Fed's thinking, not the decision itself. The FOMC will weigh tomorrow's CPI, the August employment report (which showed job losses), PCE trends, and financial stability risks before deciding. CME FedWatch prices roughly 60% odds of a hike, a strong lean, not a certainty.
How does PPI feed into PCE, the Fed's actual inflation target?
Specific PPI components, particularly services prices for healthcare, transportation, legal services, and portfolio management, are inputs used to construct the PCE deflator published by the Bureau of Economic Analysis. A hot goods PPI driven by energy doesn't map one-to-one into PCE, but it raises the floor. With PCE already running at 3.7% on a 12-month basis per Warsh's own Jackson Hole remarks, the bar for a dovish pivot is high.
What does a hike-or-hold decision mean for Bitcoin over any relevant horizon?
Short-term, higher rates tighten dollar liquidity and can pressure risk assets including Bitcoin. The more durable dynamic is what a hiking cycle into a debt-saturated government does to the dollar's long-run purchasing power. Higher borrowing costs layered on top of energy-driven inflation the Fed cannot fully suppress is the stagflation scenario where a hard-capped asset with no counterparty risk becomes harder to dismiss. Both paths on September 16, hike or hold, carry a debasement shadow.