An Analysis of Gold Prices Over the Last 52 Years
The historical analysis of gold prices over 52 years reveals a market that has its ups and downs, influenced by various global events and economic policies.

Historical Price Movements
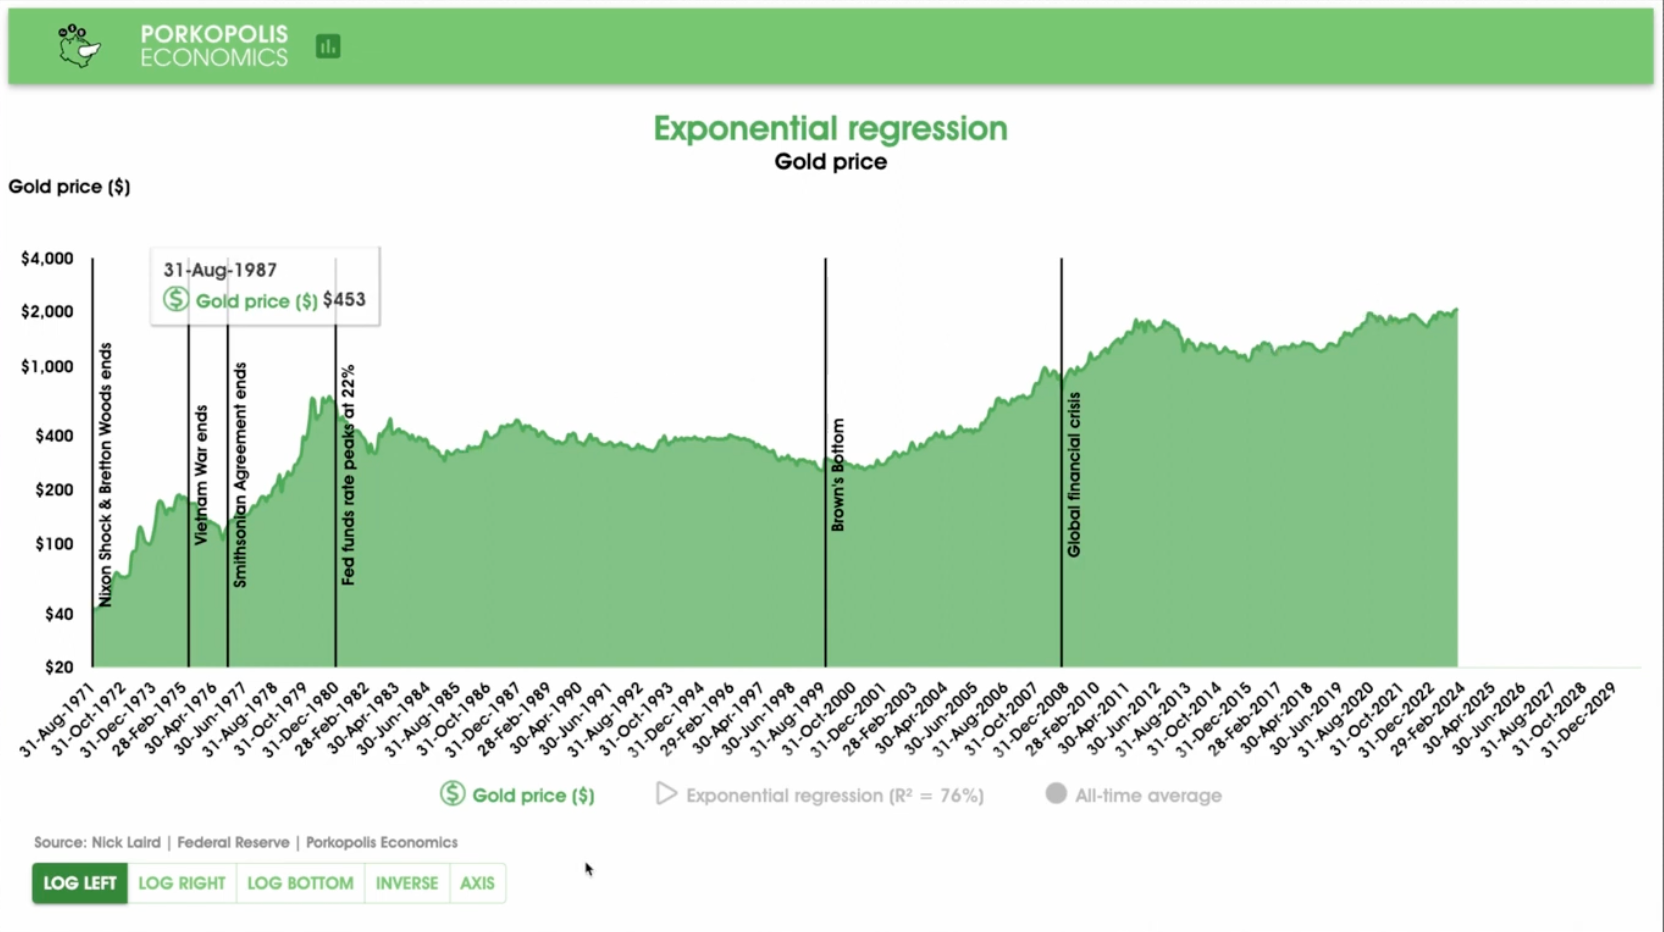
The gold market has experienced significant fluctuations over the past 52 years. Since the early 1970s, the gold price has seen a substantial rise, particularly during the period of stagflation in that decade. The removal of the gold standard, colloquially known as the Nixon shock on August 15, 1971, transitioned currencies into a pure fiat system. Subsequent economic uncertainty, coupled with the end of the Vietnam War, saw gold reach unprecedented levels.
The aggressive monetary policy under Federal Reserve Chairman Paul Volcker, which included raising interest rates to 15-16%, eventually subdued the surging gold prices. From this point, the gold market entered a bear phase that lasted until around the year 2000. Since 2000, the market has generally been bullish on gold, with prices soaring to new heights during the global financial crisis and again during the recent COVID-19 pandemic, reaching an all-time high of over $2,000 per ounce.
Trend Analysis
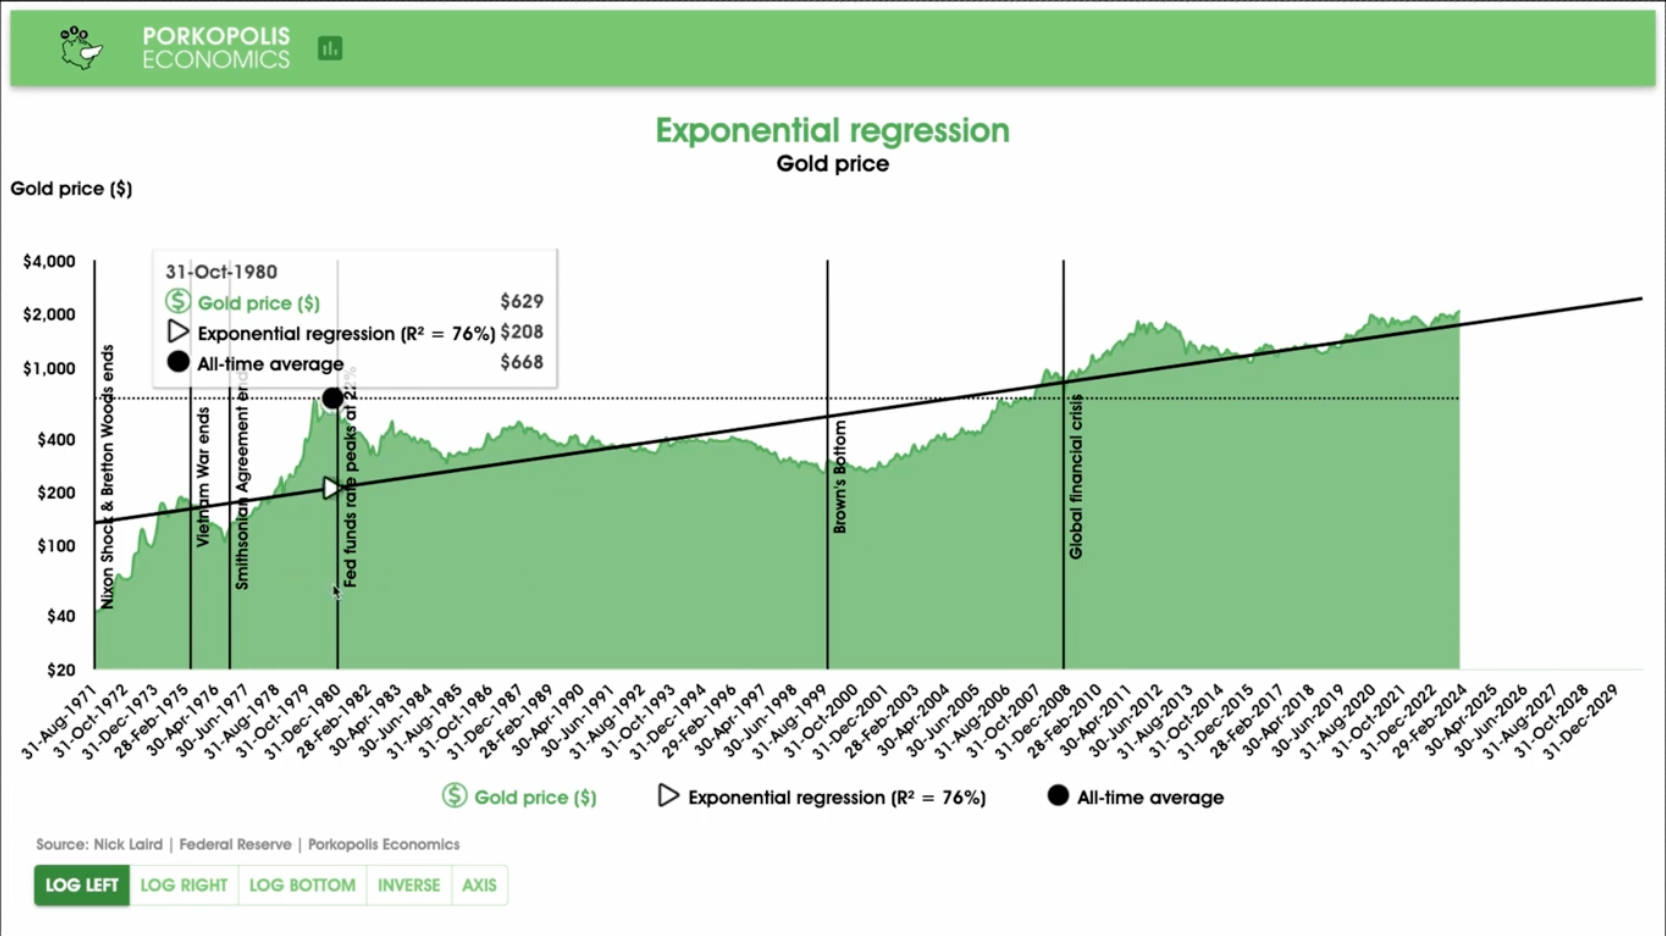
An exponential regression trendline, which is commonly applied to financial markets due to their exponential nature, shows a clear upward trajectory for gold prices on a logarithmic scale. This analysis takes into account daily gold price data and yields an R-squared value—or the goodness of fit—of 76%. While this indicates a reasonably strong correlation between the trendline and actual prices, it also acknowledges that there is room for significant variance.
Future Projections
Extending the exponential regression trendline to December 31, 2030, yields a projected gold price of $2,432 per ounce. This projection suggests a modest increase from the current highs, but does not indicate an explosive growth in price. The R-squared value implies that while there is a trend, the actual prices can and have deviated quite substantially from the trendline, both above and below.

Comparison with Historical Averages
The all-time average gold price over the 52-year period is calculated at $668 per ounce. This average, while not typically useful in predicting future financial market movements, does provide a benchmark for historical comparison. For instance, the average price was very close to the peak of the market in 1980, after which prices declined for about two decades.
Investment Implications
The analysis suggests that while gold has been a historically reliable asset, its performance when evaluated against a long-term exponential trendline is relatively unspectacular. The price of gold has shown periods of excitement, followed by dull phases. Its current position above the historical average by a factor of two indicates a strong market but does not suggest a steep upward trajectory.
Digital Assets and Gold
In the context of emerging digital assets like Bitcoin, which are part of a significant shift toward digital currencies, the growth potential and adoption curve may differ from that of traditional assets like gold. While gold has been valued for thousands of years and remains a symbol of wealth and a hedge against uncertainty, its growth rate and demand in the market are not showing signs of aggressive acceleration that could be expected if there were substantial issues with the fiat monetary system.
Conclusion
In summary, the historical analysis of gold prices over 52 years reveals a market that has its ups and downs, influenced by various global events and economic policies. While the long-term trend is upward, the moderate R-squared suggests that gold prices have not consistently kept pace with the exponential trendline. The projection for 2030 does not forecast a dramatic increase, indicating that gold may continue to serve as insurance in an investment portfolio rather than a high-growth asset.