


Explore an in-depth analysis of Bitcoin's market capitalization and miner revenue, including the Bitcoin Price to Sales Ratio (PSR), historical trends, and economic implications as of year-end 2023.
Here's an insightful year-end video breaking down the correlation between Bitcoin's market capitalization and miner revenue was meticulously examined. The discussion ventured beyond superficial analysis, focusing on the trailing twelve-month rolling network revenue to miners, a holistic approach offering a panoramic perspective on Bitcoin's economic ecosystem.
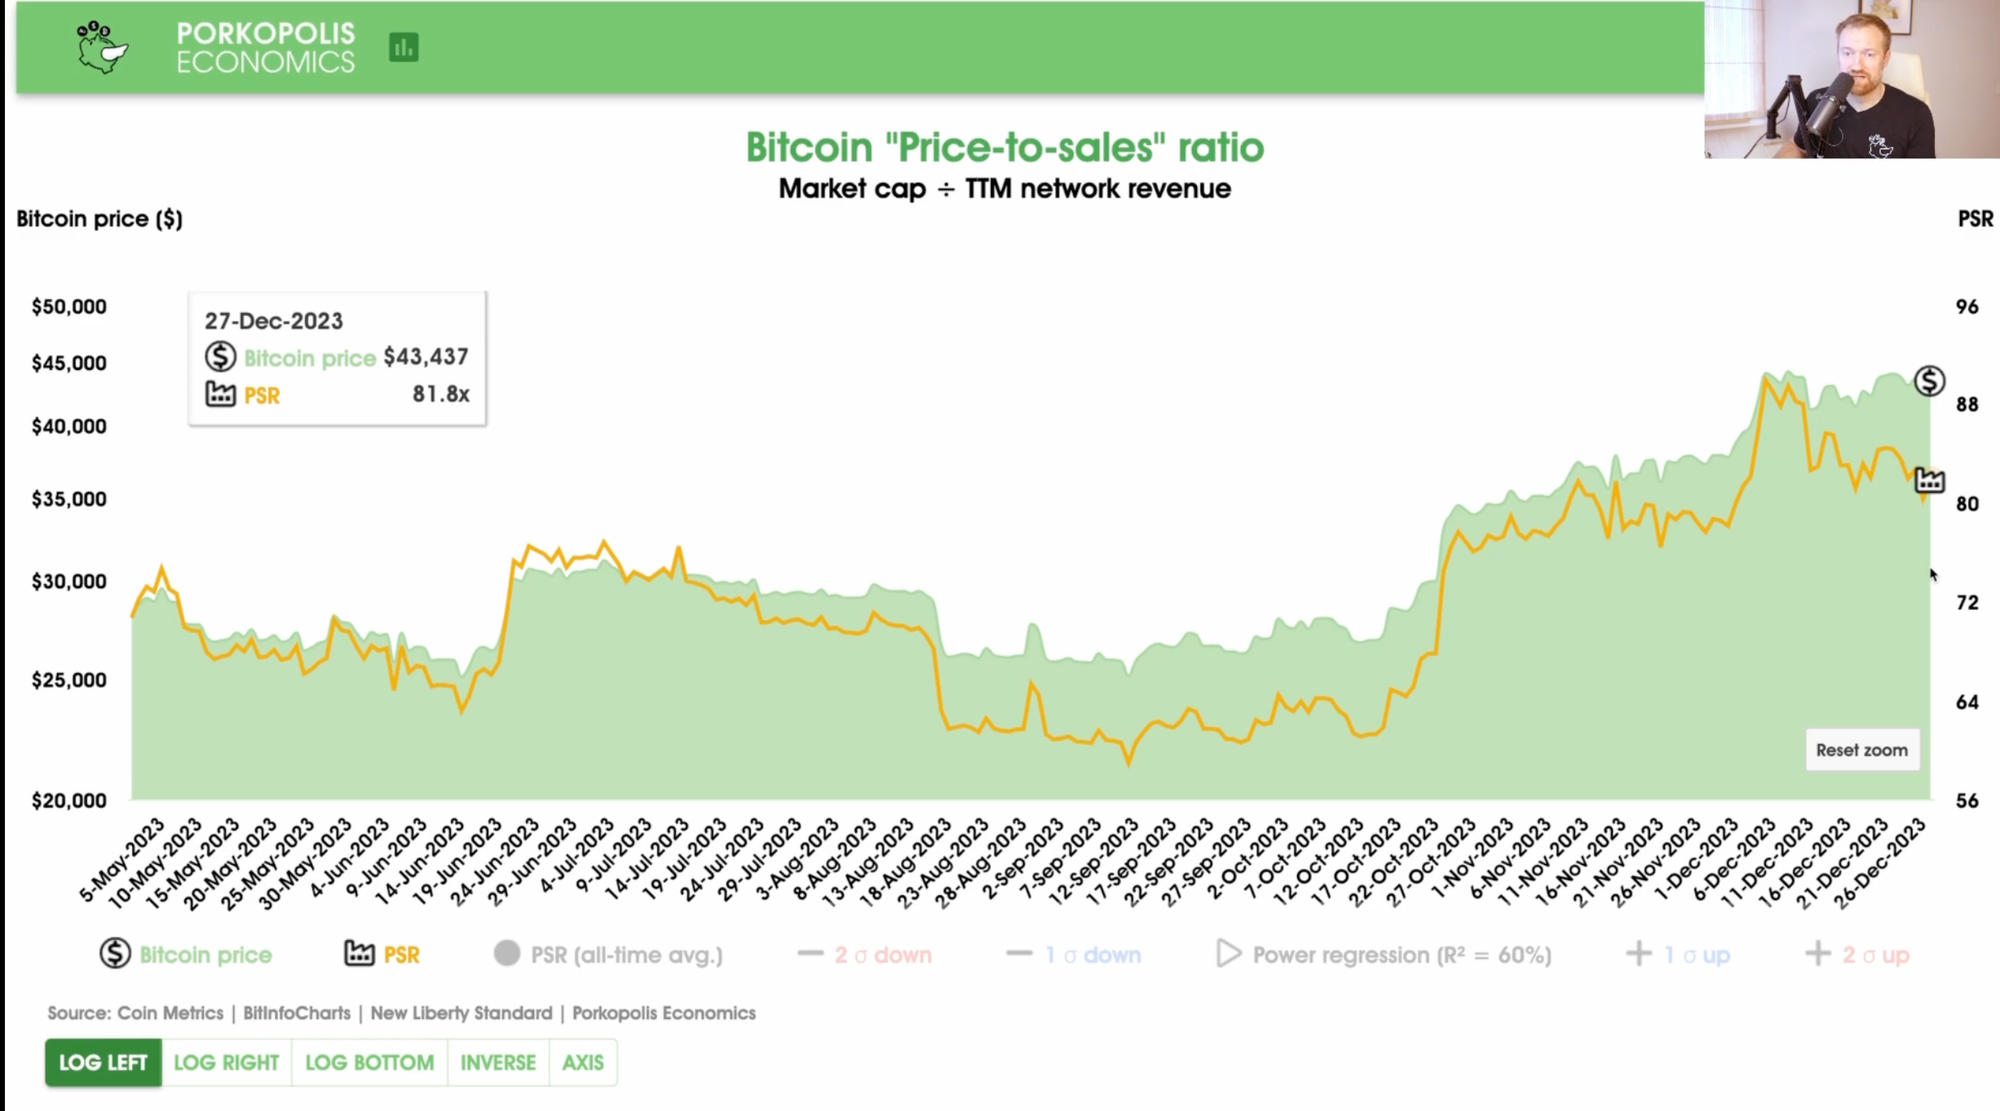
As of December 27, 2023, Bitcoin's price hovered at approximately $43,400, with a noteworthy market capitalization of about $850 billion. This figure surpasses the market cap of financial giants like Visa and Mastercard, underscoring Bitcoin's stature in the financial arena. However, it's crucial to note that Bitcoin operates more comparably to the monetary base of nation-states rather than as a transactional network like Visa and Mastercard, with the U.S. dollar monetary base standing at around $5.5 trillion.
The analysis highlighted miner revenue over a twelve-month period, an aggregate of transaction fees, including those from ordinals and inscriptions, and block subsidies—currently at 6.25 bitcoin per block. This revenue summed up to an impressive $10.4 billion.
A key metric introduced in the video is the Bitcoin Price to Sales Ratio (PSR), which divides the market cap by the trailing twelve-month network revenue. As of the recording, this ratio stood at 81.8x, providing a lens through which to interpret the relative value Bitcoin delivers to its users.
The video further delves into the PSR's historical context, showcasing its variations during different market cycles. Notably, spikes in the ratio were observed during peak periods such as 2013, 2017, and 2021, reflecting times when the market cap significantly outpaced miner revenue.
A regression trendline was employed to better understand the long-term trajectory of the PSR, with standard deviations used to establish ranges where the multiple typically resides. The video emphasizes that the current PSR, slightly above the regression trendline, suggests a somewhat heated market, albeit well within normal historical fluctuations.
Matthew also points out that the PSR is a gross figure, indicative of revenue before expenses, and therefore not directly comparable to Price to Earnings (PE) ratios used in stock market analysis. The unique nature of the Bitcoin network and the transparent blockchain technology makes the PSR a clear and distinct metric for assessing economic value.
In summary, the video presents a comprehensive and nuanced view of Bitcoin's economic indicators as the year 2023 concludes. It stresses the significance of understanding the intricate relationship between market cap and miner revenue to truly appreciate the relative value and growth trajectory of the Bitcoin network.


